由于corrplot包画图存在一些问题,比如图像不美观,以及title显示不出,等等
于是有了ggplot2 的扩展系列
ggcorrplot包 专门画相关系数矩阵图: https://github.com/kassambara/ggcorrplot
GGally 包: 对ggplot2进行了更多的扩展,其中包括相关系数图: http://ggobi.github.io/ggally/index.html#alterations
ggcorrplot包
library(ggcorrplot)
library(purrr)
data(mtcars)
corr <- cor(mtcars) # 相关系数矩阵
corr %>% head()
#>             mpg        cyl       disp         hp       drat         wt
#> mpg   1.0000000 -0.8521620 -0.8475514 -0.7761684  0.6811719 -0.8676594
#> cyl  -0.8521620  1.0000000  0.9020329  0.8324475 -0.6999381  0.7824958
#> disp -0.8475514  0.9020329  1.0000000  0.7909486 -0.7102139  0.8879799
#> hp   -0.7761684  0.8324475  0.7909486  1.0000000 -0.4487591  0.6587479
#> drat  0.6811719 -0.6999381 -0.7102139 -0.4487591  1.0000000 -0.7124406
#> wt   -0.8676594  0.7824958  0.8879799  0.6587479 -0.7124406  1.0000000
#>             qsec         vs         am       gear       carb
#> mpg   0.41868403  0.6640389  0.5998324  0.4802848 -0.5509251
#> cyl  -0.59124207 -0.8108118 -0.5226070 -0.4926866  0.5269883
#> disp -0.43369788 -0.7104159 -0.5912270 -0.5555692  0.3949769
#> hp   -0.70822339 -0.7230967 -0.2432043 -0.1257043  0.7498125
#> drat  0.09120476  0.4402785  0.7127111  0.6996101 -0.0907898
#> wt   -0.17471588 -0.5549157 -0.6924953 -0.5832870  0.4276059

# Compute a matrix of correlation p-values
p.mat <- cor_pmat(mtcars) # 计算矩阵之间的相关性p—值
p.mat %>% head()
#>               mpg          cyl         disp           hp         drat
#> mpg  0.000000e+00 6.112687e-10 9.380327e-10 1.787835e-07 1.776240e-05
#> cyl  6.112687e-10 0.000000e+00 1.802838e-12 3.477861e-09 8.244636e-06
#> disp 9.380327e-10 1.802838e-12 0.000000e+00 7.142679e-08 5.282022e-06
#> hp   1.787835e-07 3.477861e-09 7.142679e-08 0.000000e+00 9.988772e-03
#> drat 1.776240e-05 8.244636e-06 5.282022e-06 9.988772e-03 0.000000e+00
#> wt   1.293959e-10 1.217567e-07 1.222320e-11 4.145827e-05 4.784260e-06
#>                wt         qsec           vs           am         gear
#> mpg  1.293959e-10 1.708199e-02 3.415937e-05 2.850207e-04 5.400948e-03
#> cyl  1.217567e-07 3.660533e-04 1.843018e-08 2.151207e-03 4.173297e-03
#> disp 1.222320e-11 1.314404e-02 5.235012e-06 3.662114e-04 9.635921e-04
#> hp   4.145827e-05 5.766253e-06 2.940896e-06 1.798309e-01 4.930119e-01
#> drat 4.784260e-06 6.195826e-01 1.167553e-02 4.726790e-06 8.360110e-06
#> wt   0.000000e+00 3.388683e-01 9.798492e-04 1.125440e-05 4.586601e-04
#>              carb
#> mpg  1.084446e-03
#> cyl  1.942340e-03
#> disp 2.526789e-02
#> hp   7.827810e-07
#> drat 6.211834e-01
#> wt   1.463861e-02

## 相关矩阵可视化
ggcorrplot(corr)# #method默认为square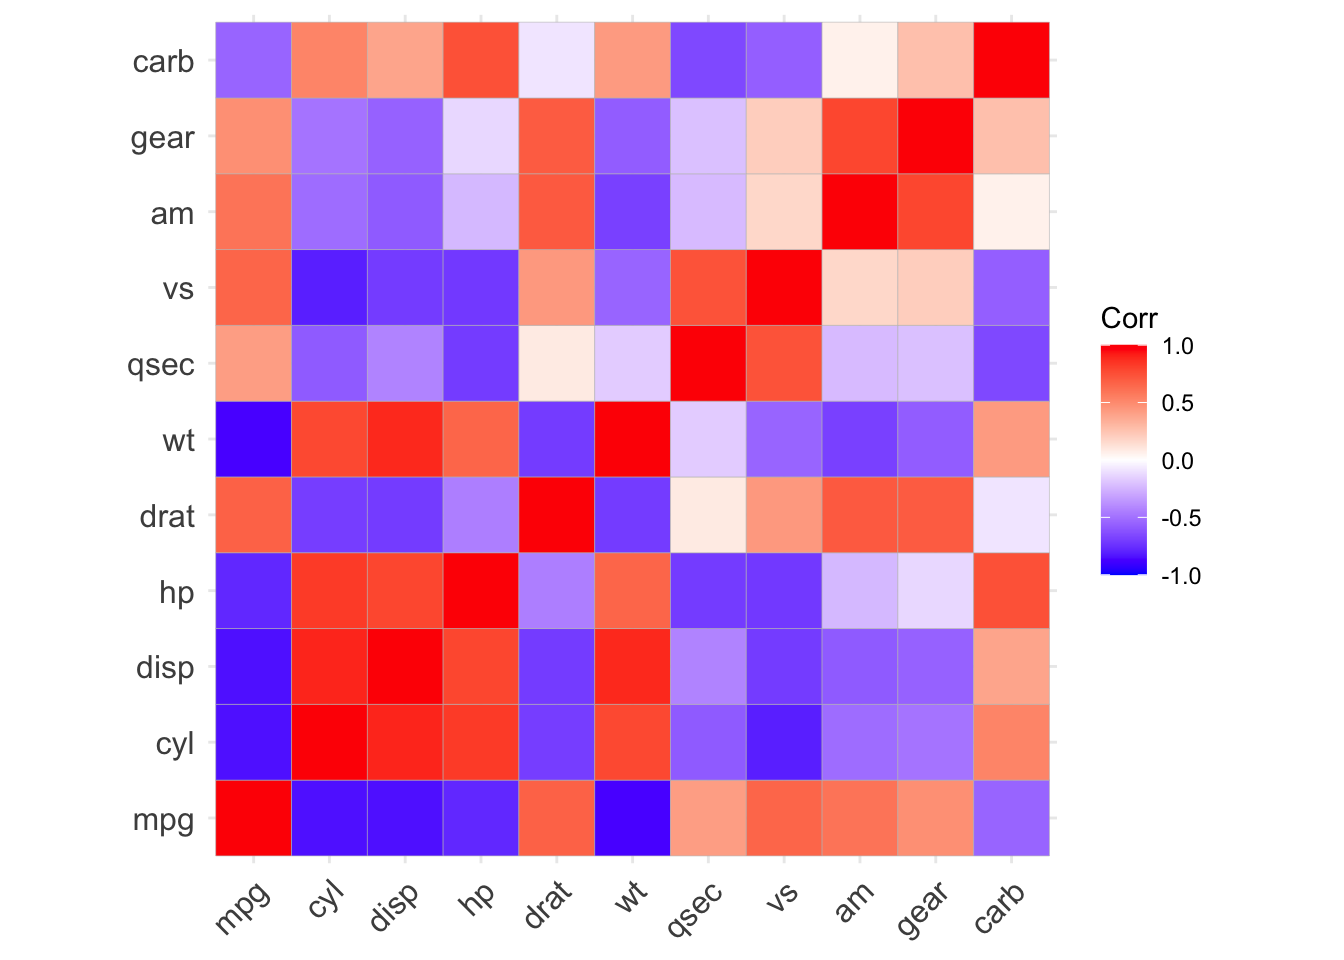
ggcorrplot(corr, method = "circle")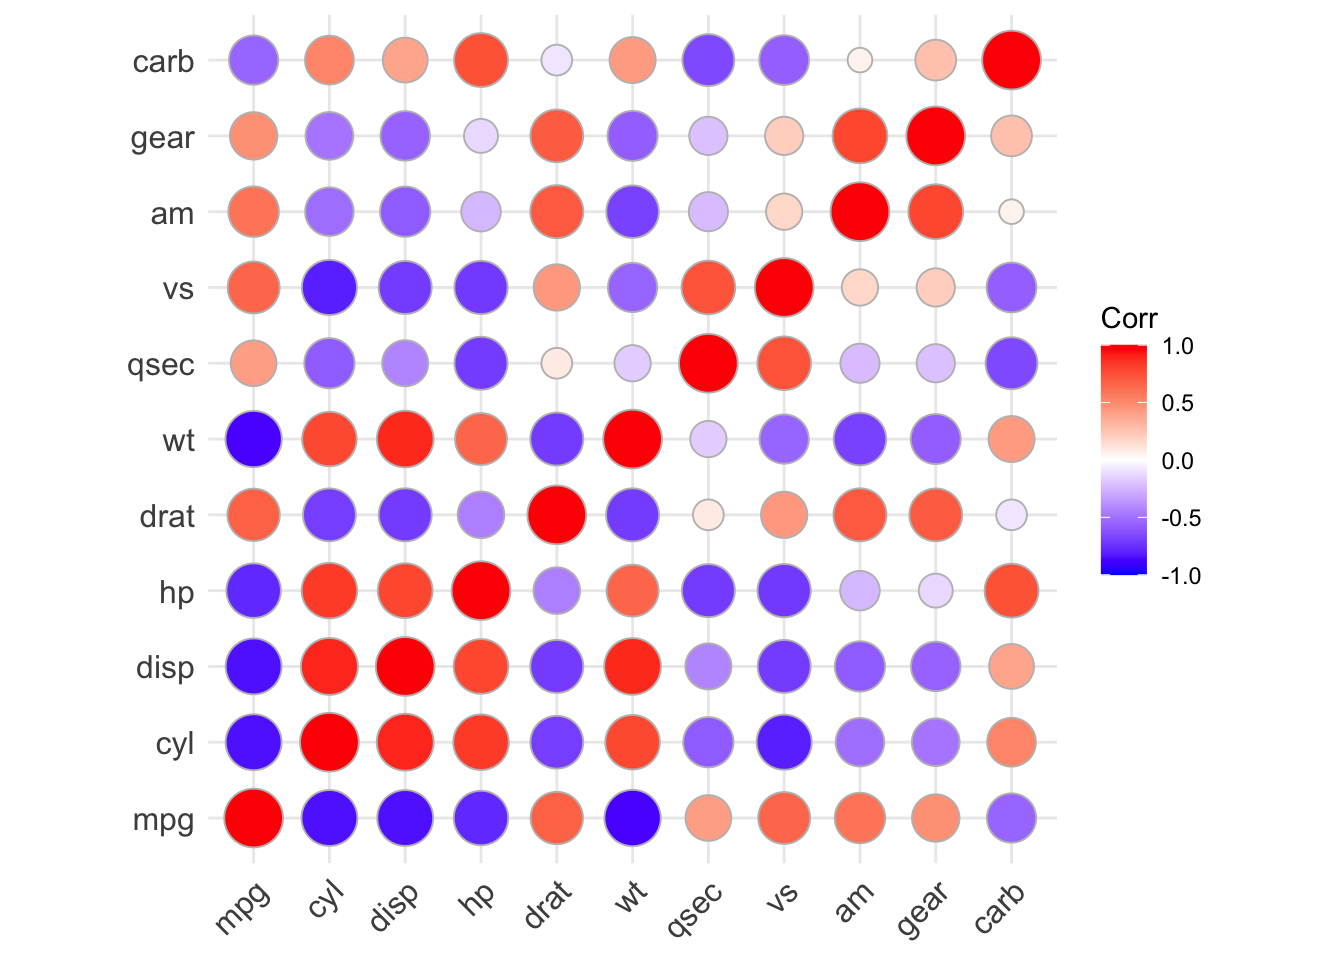
## 重新排序相关矩阵
#### 使用分层聚类
ggcorrplot(corr, hc.order = TRUE, outline.col = "white")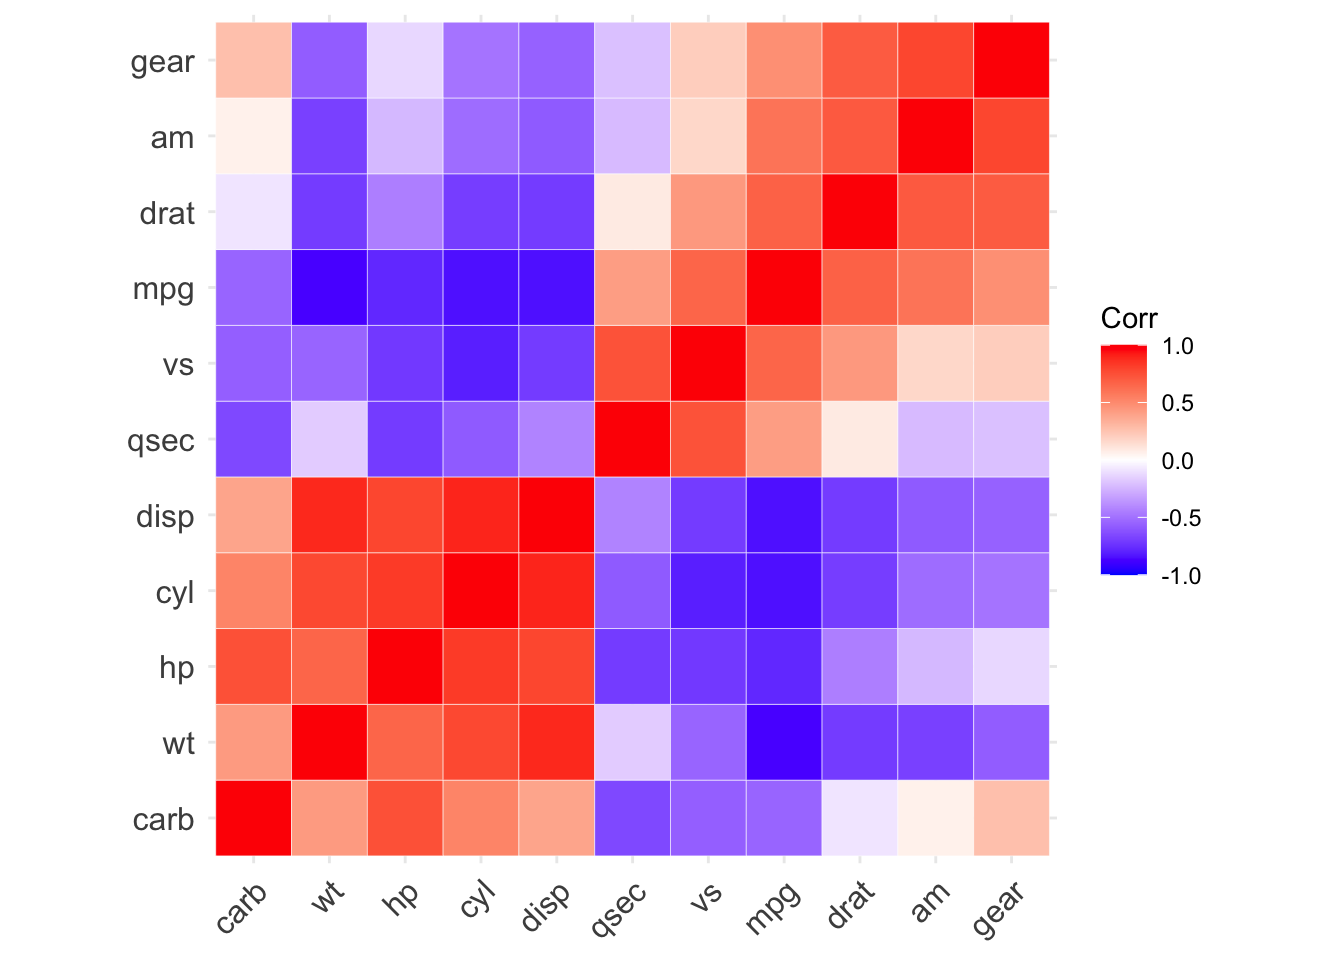
## 相关图布局的类型
ggcorrplot(corr, hc.order = TRUE, type = "lower",outline.col = "white")#下三角矩阵图
ggcorrplot(corr, hc.order = TRUE, type = "upper",outline.col = "white")#上三角矩阵图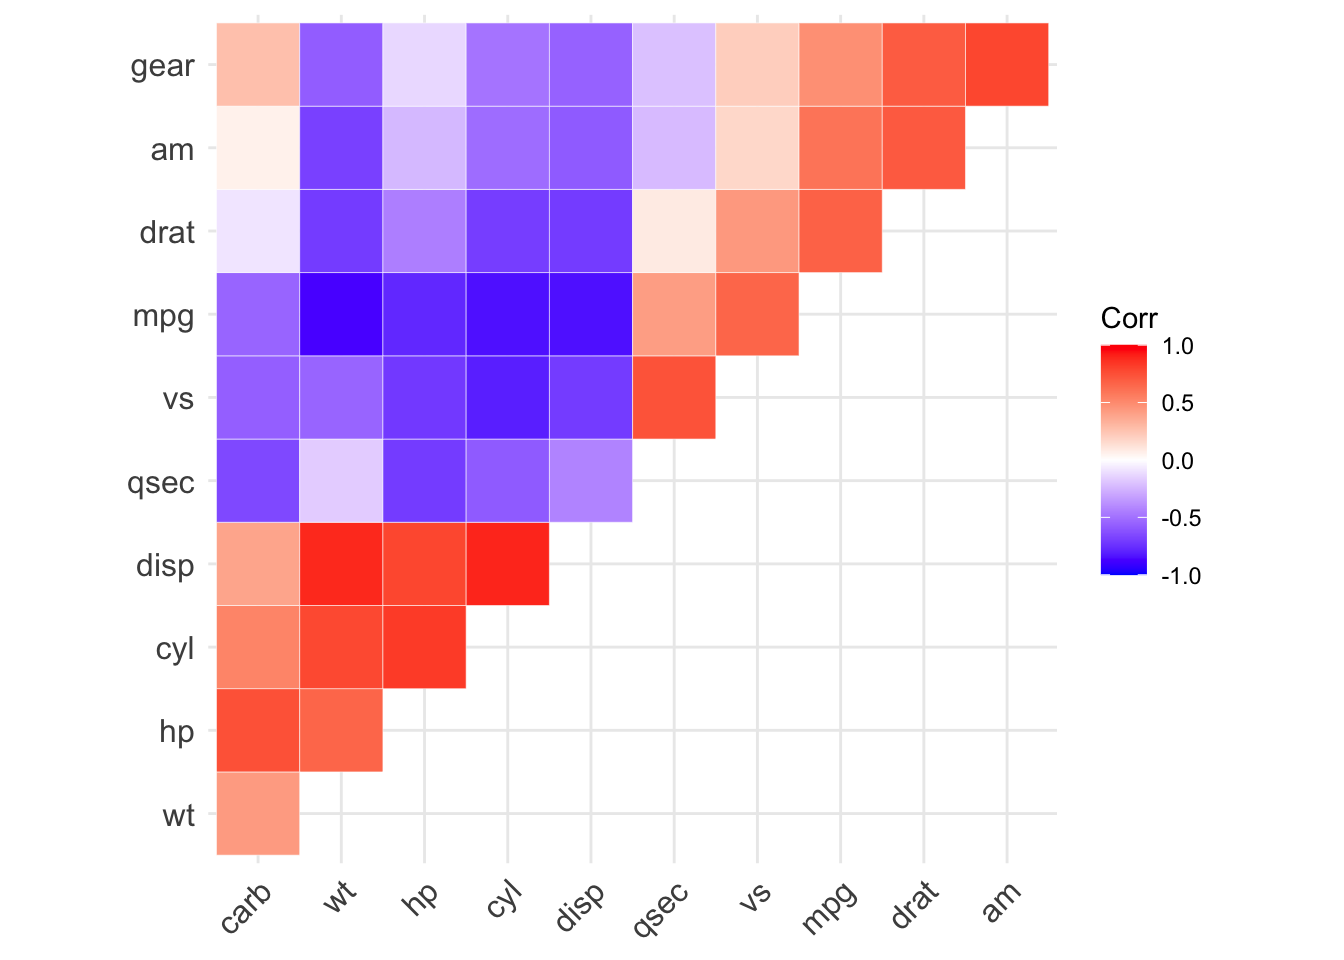
## 更改颜色以及主题
####  colors参数
ggcorrplot(corr, hc.order = TRUE, type = "lower",
   outline.col = "white",
   ggtheme = ggplot2::theme_gray,
   colors = c("#6D9EC1", "white", "#E46726"))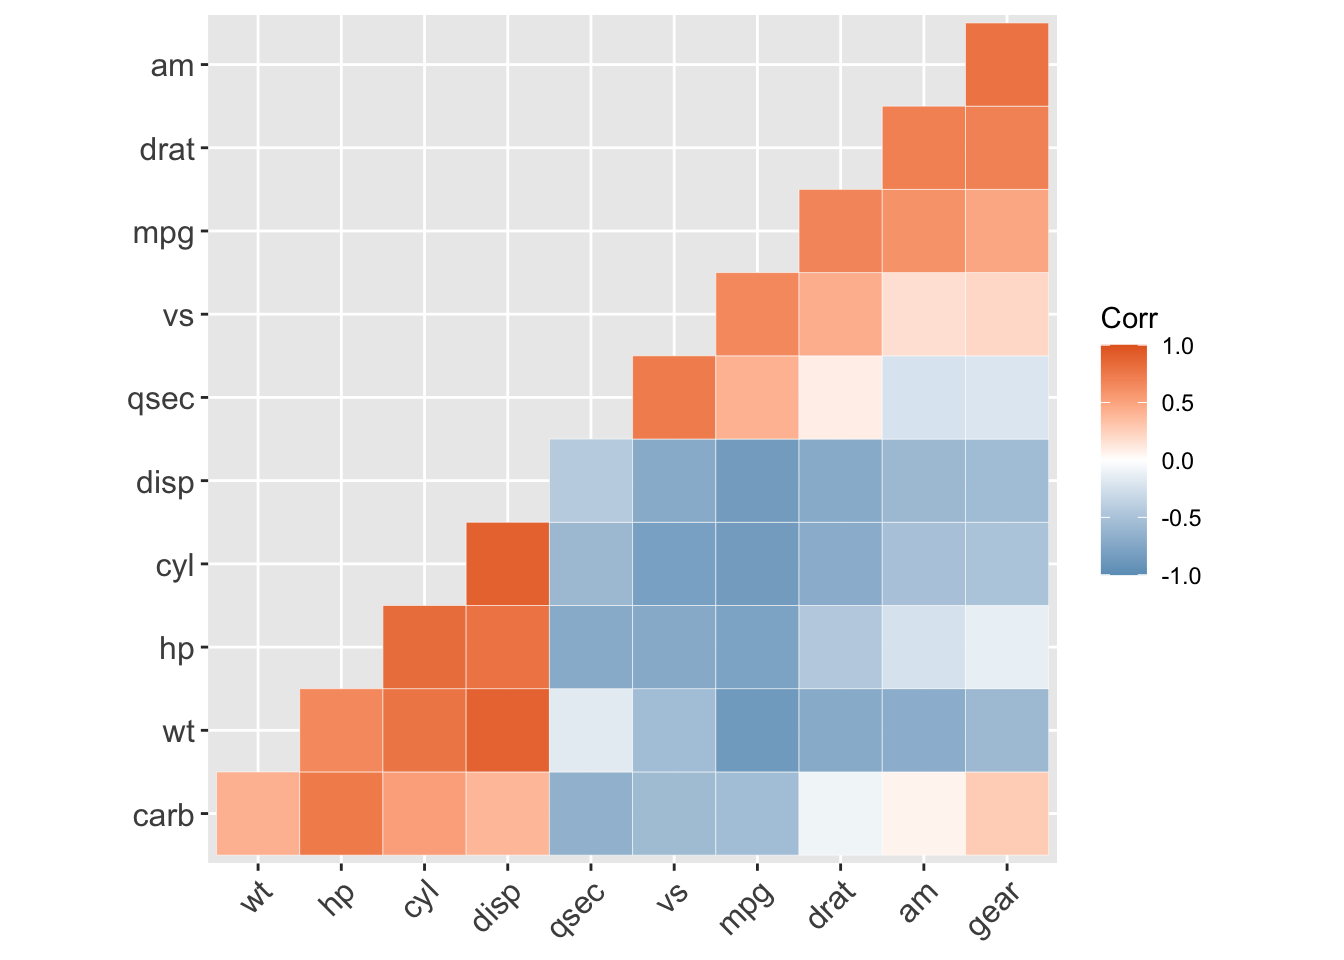
## 添加相关系数
#### 设置参数lab = TRUE
ggcorrplot(corr, hc.order = TRUE, type = "lower",lab = TRUE)#添加相关系数, 设置参数lab = TRUE
## 增加显著性水平,不显著的话就不添加了
#### 设置参数p.mat
ggcorrplot(corr, hc.order = TRUE,type = "lower", p.mat = p.mat) # 增加显著性水平,设置参数p.mat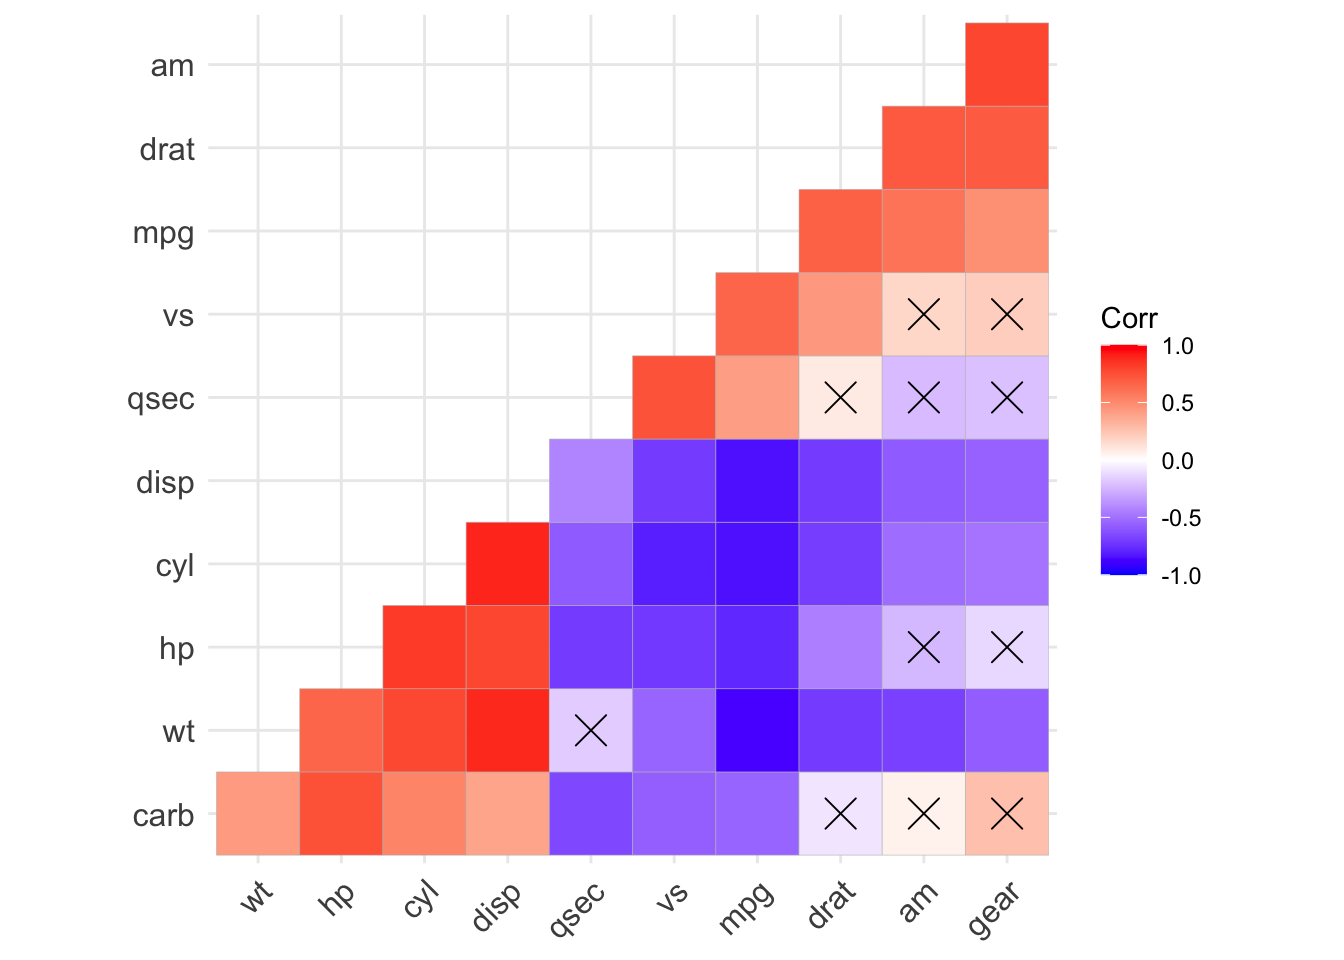
ggcorrplot(corr, p.mat = p.mat, hc.order=TRUE, type = "lower", insig = "blank")# 将不显著的色块设置成空白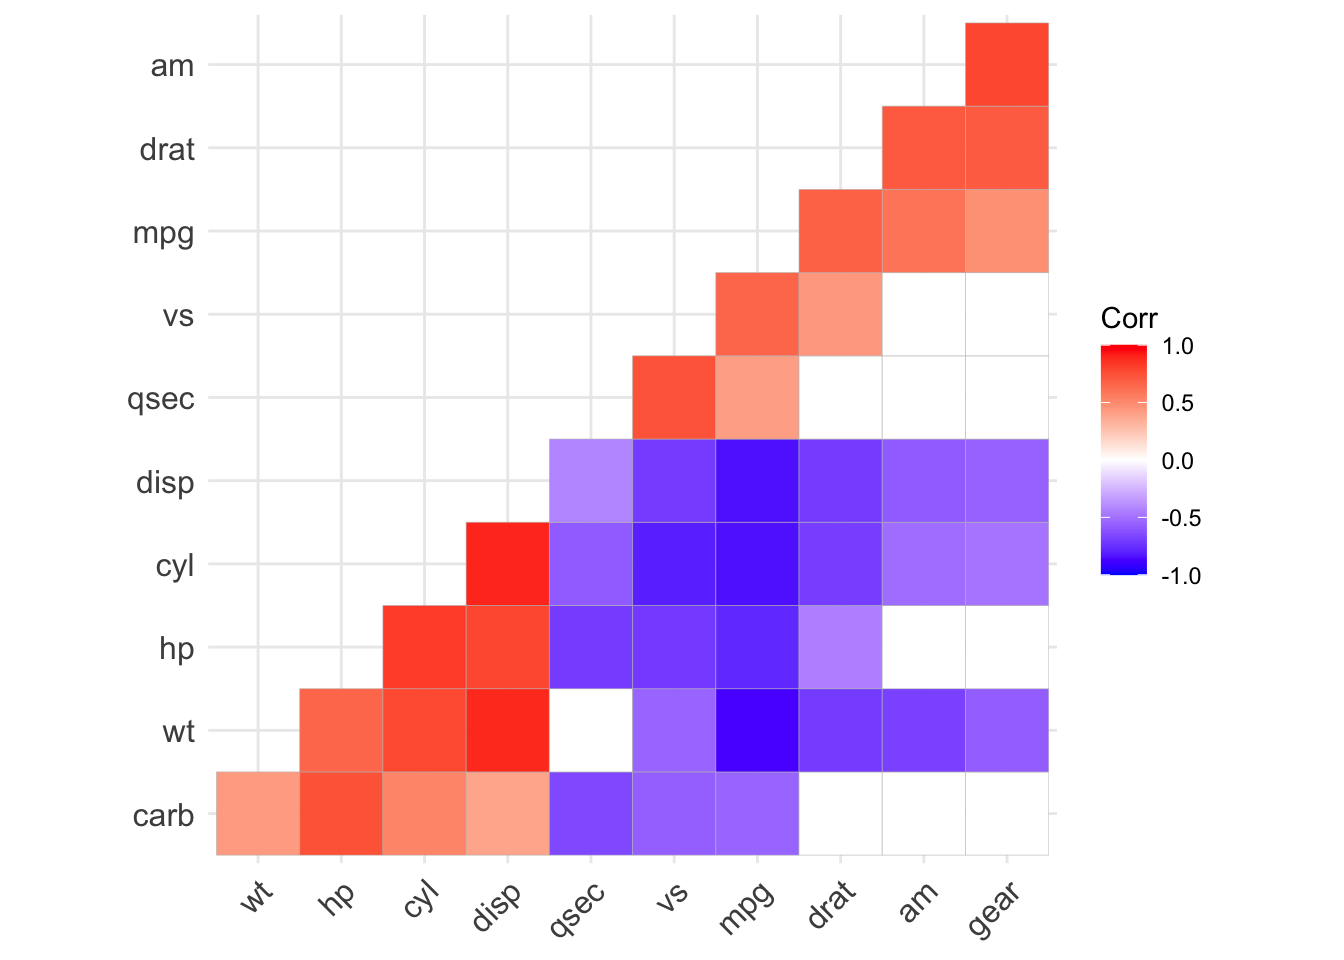
## 可以添加标题,像ggplot2那样添加标题, 这样好看一些
ggcorrplot(corr)+ggtitle("mtcars的相关矩阵图")+ theme(plot.title = element_text(hjust = 0.5))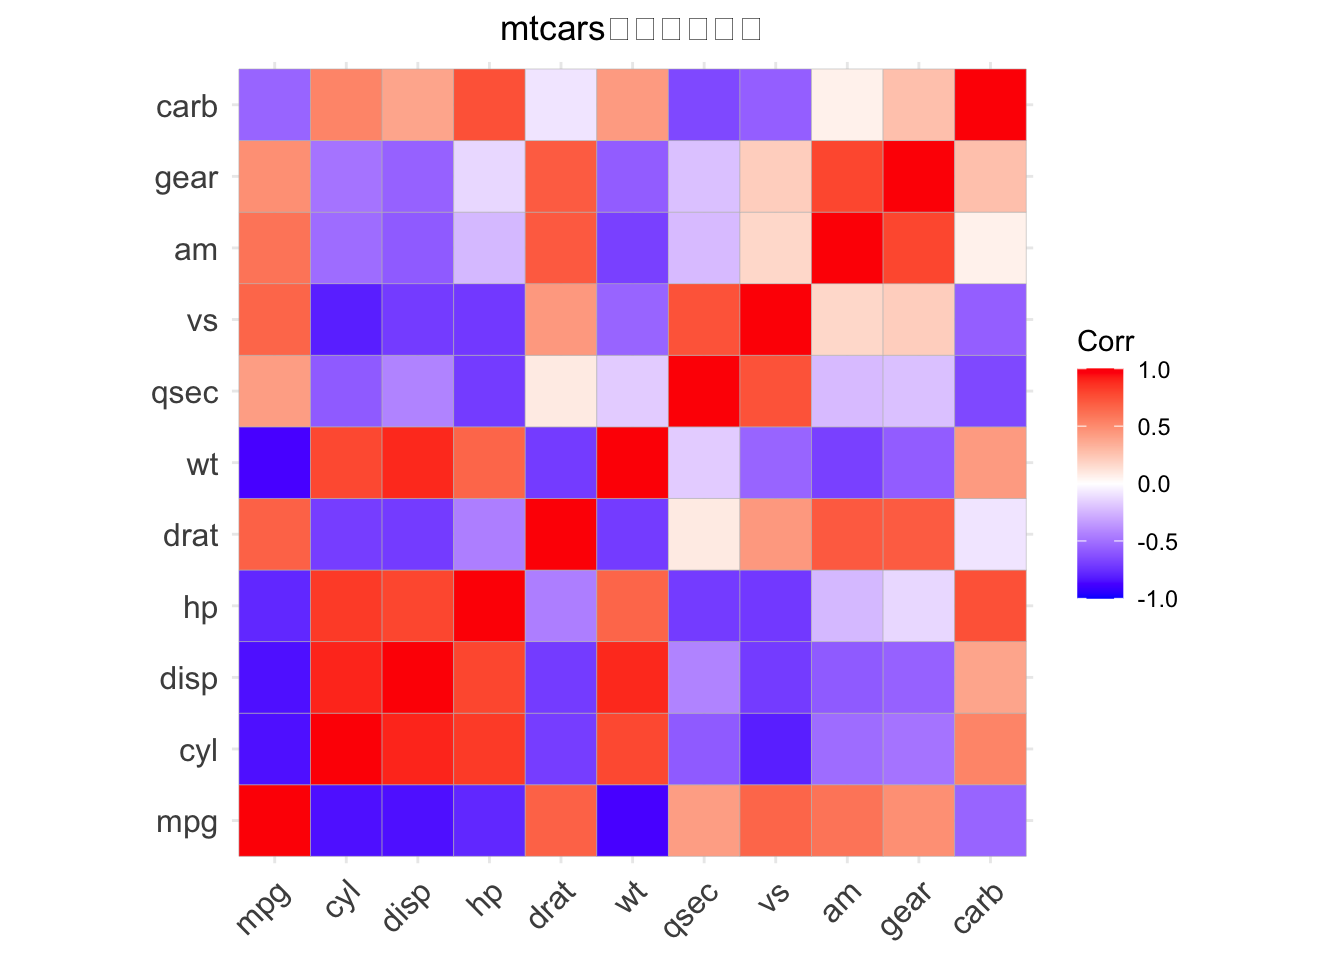
sessionInfo()
#> R version 4.0.2 (2020-06-22)
#> Platform: x86_64-apple-darwin17.0 (64-bit)
#> Running under: macOS Mojave 10.14.5
#>
#> Matrix products: default
#> BLAS:   /Library/Frameworks/R.framework/Versions/4.0/Resources/lib/libRblas.dylib
#> LAPACK: /Library/Frameworks/R.framework/Versions/4.0/Resources/lib/libRlapack.dylib
#>
#> locale:
#> [1] zh_CN.UTF-8/zh_CN.UTF-8/zh_CN.UTF-8/C/zh_CN.UTF-8/zh_CN.UTF-8
#>
#> attached base packages:
#> [1] stats     graphics  grDevices utils     datasets  methods   base
#>
#> other attached packages:
#> [1] purrr_0.3.4      ggcorrplot_0.1.3 ggplot2_3.3.2
#>
#> loaded via a namespace (and not attached):
#>  [1] Rcpp_1.0.5       pillar_1.4.6     compiler_4.0.2   plyr_1.8.6
#>  [5] tools_4.0.2      digest_0.6.25    evaluate_0.14    lifecycle_0.2.0
#>  [9] tibble_3.0.3     gtable_0.3.0     pkgconfig_2.0.3  rlang_0.4.7
#> [13] yaml_2.2.1       blogdown_0.20    xfun_0.17        withr_2.2.0
#> [17] stringr_1.4.0    dplyr_1.0.1      knitr_1.29       generics_0.0.2
#> [21] vctrs_0.3.2      grid_4.0.2       tidyselect_1.1.0 glue_1.4.1
#> [25] R6_2.4.1         rmarkdown_2.3    bookdown_0.20    reshape2_1.4.4
#> [29] farver_2.0.3     magrittr_1.5     scales_1.1.1     ellipsis_0.3.1
#> [33] htmltools_0.5.0  colorspace_1.4-1 labeling_0.3     stringi_1.4.6
#> [37] munsell_0.5.0    crayon_1.3.4