相关矩阵图二—–corrplot
corrplot::corrplot()函数
由于corrgram::corrgram()函数没有显示相关性的大小度量关系,于是经常用corrplot::corrplot()函数来画相关矩阵图,不过此图的缺点是title画出来不好看
corrplot(corr,
  method = c("circle", "square", "ellipse", "number", "shade","color", "pie"),
  type = c("full", "lower", "upper"), add = FALSE,
  col = NULL, bg = "white", title = "", is.corr = TRUE, diag = TRUE,
  outline = FALSE, mar = c(0, 0, 0, 0), addgrid.col = NULL,
  addCoef.col = NULL, addCoefasPercent = FALSE, order = c("original",
  "AOE", "FPC", "hclust", "alphabet"), hclust.method = c("complete", "ward",
  "ward.D", "ward.D2", "single", "average", "mcquitty", "median", "centroid"),
  addrect = NULL, rect.col = "black", rect.lwd = 2, tl.pos = NULL,
  tl.cex = 1, tl.col = "red", tl.offset = 0.4, tl.srt = 90,
  cl.pos = NULL, cl.lim = NULL, cl.length = NULL, cl.cex = 0.8,
  cl.ratio = 0.15, cl.align.text = "c", cl.offset = 0.5, number.cex = 1,
  number.font = 2, number.digits = NULL, addshade = c("negative",
  "positive", "all"), shade.lwd = 1, shade.col = "white", p.mat = NULL,
  sig.level = 0.05, insig = c("pch", "p-value", "blank", "n", "label_sig"),
  pch = 4, pch.col = "black", pch.cex = 3, plotCI = c("n", "square",
  "circle", "rect"), lowCI.mat = NULL, uppCI.mat = NULL, na.label = "?",
  na.label.col = "black", win.asp = 1, ...)


参数解释:
corr: 用于绘图的矩阵,必须是正方形矩阵(即相关系数矩阵),如果是普通的矩阵,需要设置is.corr=FALSE
method:可以是circle(圆形,默认),square(方形),ellipse(椭圆形),number(数值),shade(阴影),color(颜色),pie(饼图)。
type:用于设置相关矩阵图的显示区域:full(全部,默认), lower(下三角), upper(上三角)。
col:指定图形展示的颜色,默认以均匀的颜色展示,可以通过colorRampPalette函数向col参数赋值来设置颜色。
bg:指定图的背景色
title:为图形添加标题
diag:是否展示对角线上的结果,默认为TRUE
outline:是否绘制圆形、方形或椭圆形的轮廓,默认为FALSE
mar:具体设置图形的四边间距
addgrid.col:当选择的方法为颜色或阴影时,默认的网格线颜色为白色,否则为灰色
addCoef.col:为相关系数添加颜色,默认不添加相关系数,只有方法为number时,该参数才起作用
addCoefasPercent:为节省绘图空间,是否将相关系数转换为百分比格式,默认为FALSE
order:指定相关系数排序的方法,一般”AOE”排序结果都比”FPC”要好
        可以是:original(原始顺序)、AOE(特征向量角序)、FPC(第一主成分顺序)、hclust(层次聚类顺序)和alphabet(字母顺序)

hclust.method:当order为hclust时,该参数可以是层次聚类中ward法、最大距离法等7种之一
addrect:当order为hclust时,可以为添加相关系数图添加矩形框,默认不添加框,如果想添加框时,只需为该参数指定一个整数即可
rect.col:指定矩形框的颜色
rect.lwd:指定矩形框的线宽
tl.pos:指定文本标签(变量名称)的位置,字符型参数为:"lt", "ld", "td", "d" or "n"
      当type=full时,默认标签位置在左边和顶部(lt),
    当type=lower时,默认标签在左边和对角线(ld),
      当type=upper时,默认标签在顶部和对角线, d表示diagonal(对角线), n表示不添加文本标签

tl.cex:指定文本标签的大小
tl.col:指定文本标签的颜色
cl.pos:图例(颜色条)位置,
      当type=upper或full时,图例在右表(r),
      当type=lower时,图例在底部,
      不需要图例时,只需指定该参数为n

addshade:只有当method=shade时,该参数才有用,
    参数值可以是negtive/positive和all,分表表示对负相关系数、正相关系数和所有相关系数添加阴影。
    注意:正相关系数的阴影是45度,负相关系数的阴影是135度

shade.lwd:指定阴影的线宽
shade.col:指定阴影线的颜色

参数 cl.*  用于设置图例的颜色(图例的色条),tl.* 用于设置图例的文本(标量名称)。
对于文本标签,这两个函数 tl.col(文本标签颜色)和tl.srt(文本标签字符串旋转)用于更改文本颜色和旋转。
使用不同的method绘制相关矩阵图
library(corrplot)

M <- cor(mtcars)
method = c("circle", "square", "ellipse", "number", "shade","color")
par(mfrow=c(3,2))
t = mapply(function(x){corrplot(M,method = x,order = "AOE",title=paste0("method=",x))},method)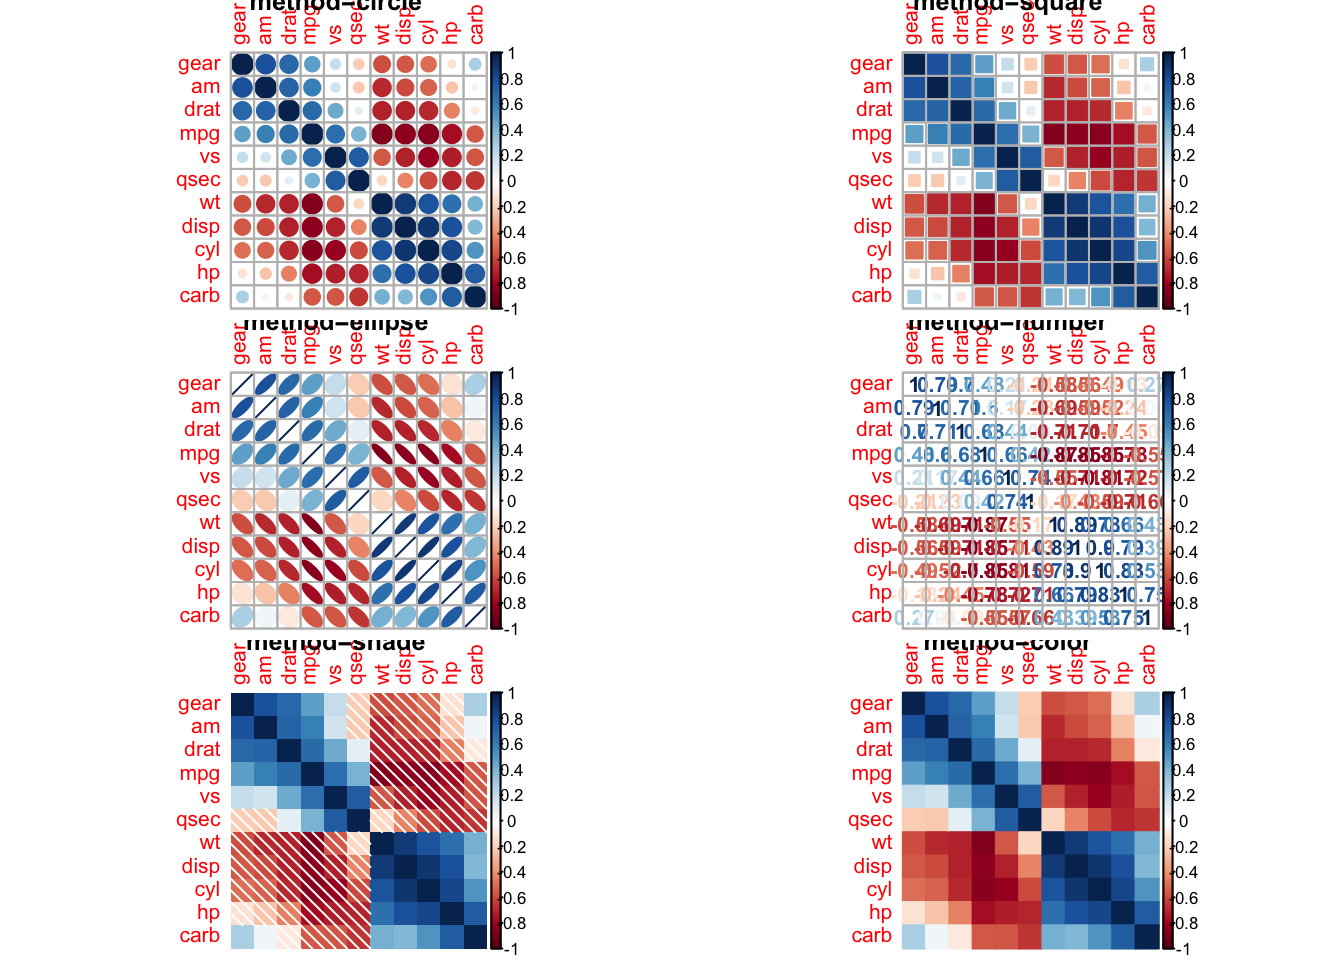
设置布局类型(参数type):
type = c(“full”, “lower”, “upper”)
corrplot.mixed() 是一个混合可视化风格的包装函数。
M <- cor(mtcars)
type = c("full", "lower", "upper")
par(mfrow=c(1,3))
t = mapply(function(x){corrplot(M,order = "hclust",type = x,title=paste0("type=",x))},type)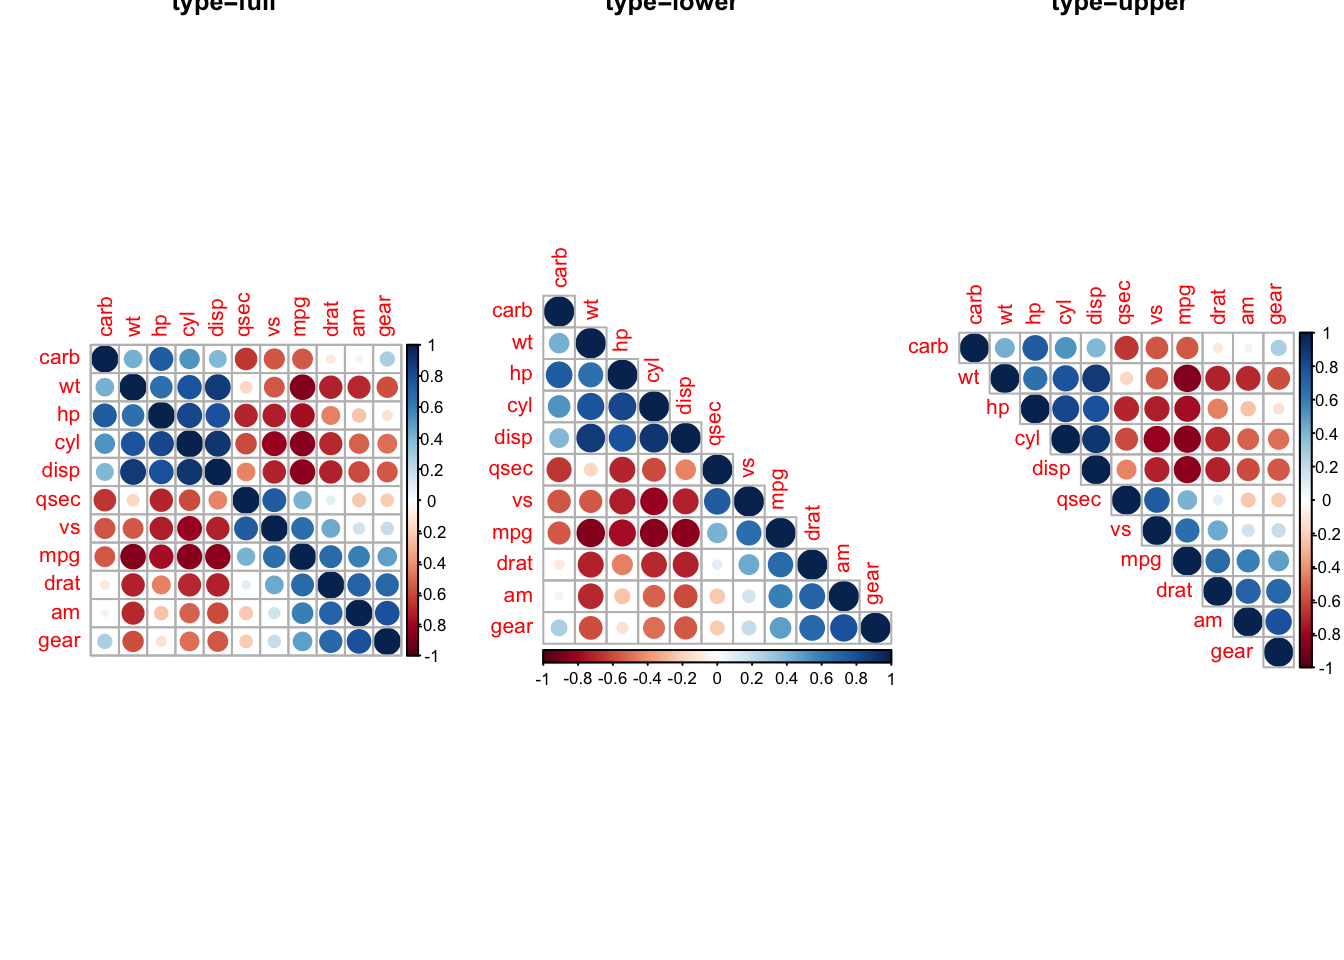
par(mfrow=c(2,2))
corrplot.mixed(M)
corrplot.mixed(M, lower.col = "black", number.cex = .7)
corrplot.mixed(M, lower = "ellipse", upper = "circle")
corrplot.mixed(M, lower = "square", upper = "circle", tl.col = "black") # tl.col:指定文本标签的颜色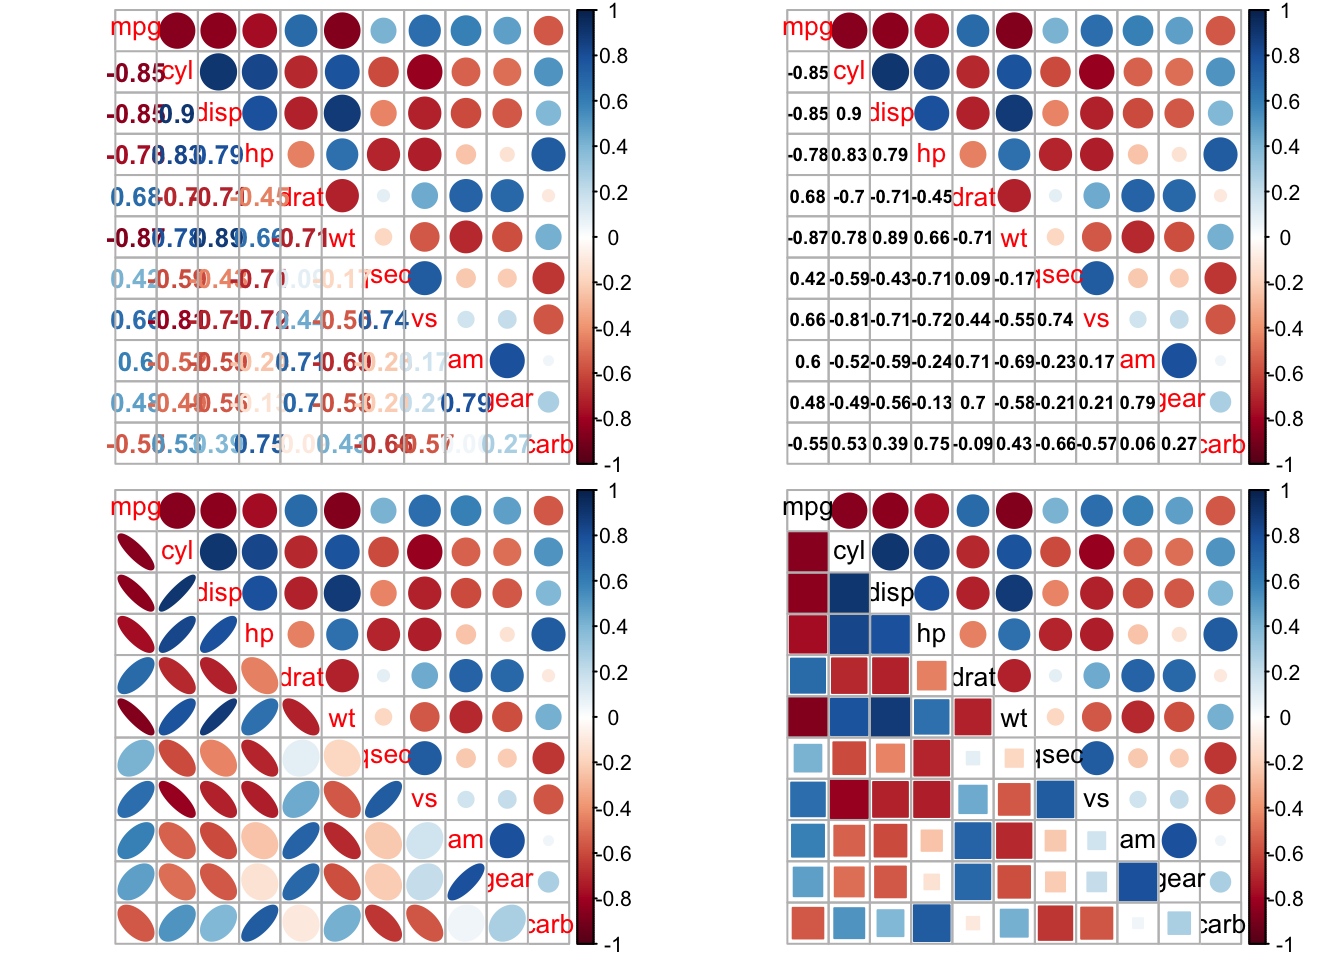
相关矩阵重排序
order = c("original","AOE", "FPC", "hclust", "alphabet")
par(mfrow=c(2,3))
t = mapply(function(x){corrplot(M,order = x,title=paste0("order=",x))},order)


####### # 如果使用"hclust",corrplot()可以根据层次聚类的结果在corrrlation矩阵图表周围绘制矩形。
par(mfrow=c(1,2))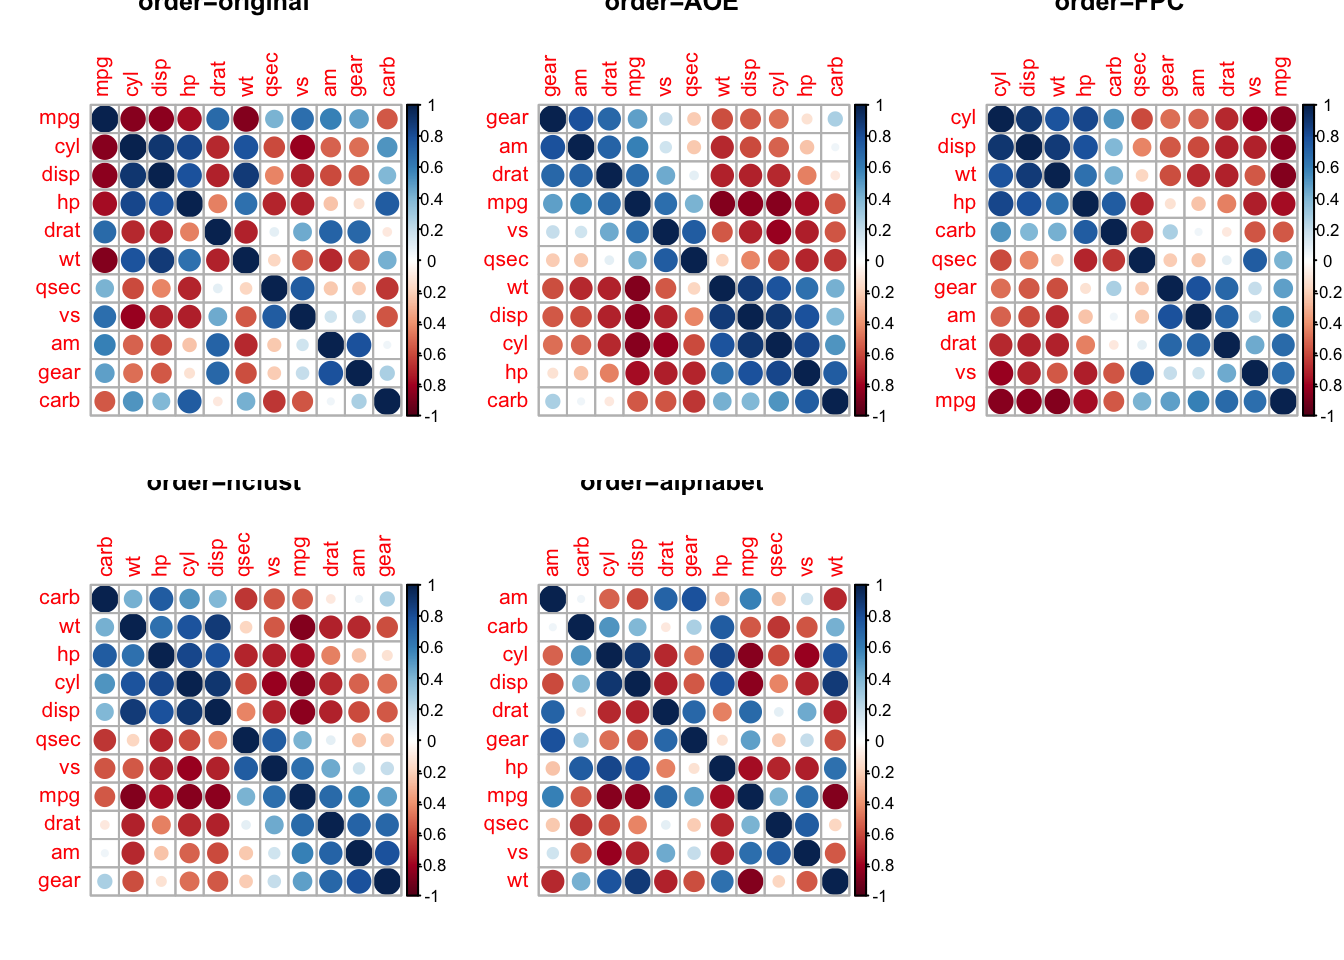
corrplot(M, order = "hclust", addrect = 2)
corrplot(M, order = "hclust", addrect = 3)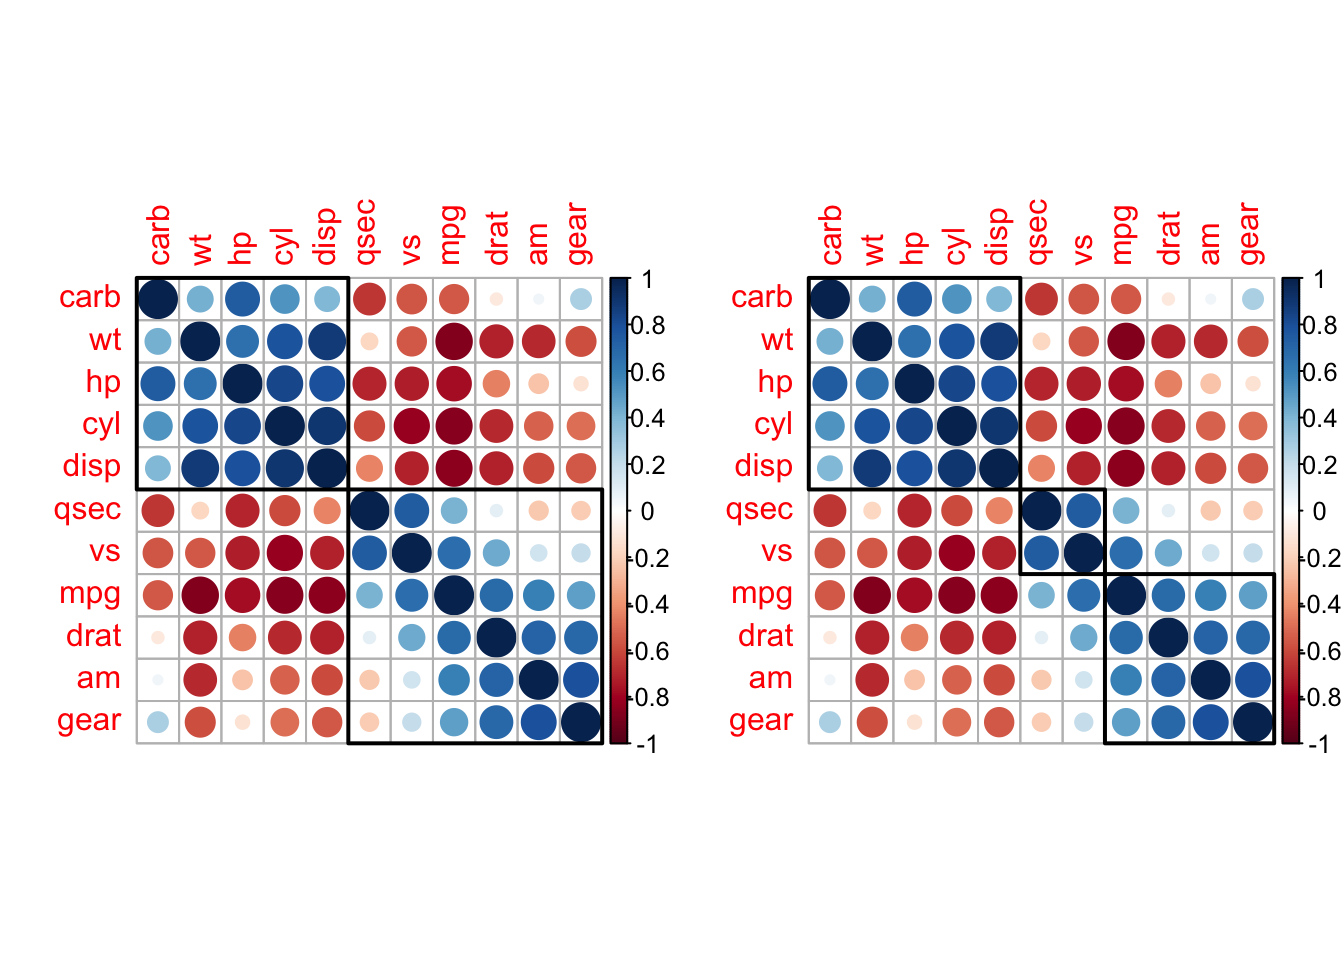
####### # 改变背景颜色以及图像颜色
par(mfrow=c(1,1))
corrplot(M, type = "upper", order = "hclust", col = c("black", "white"), bg = "lightblue")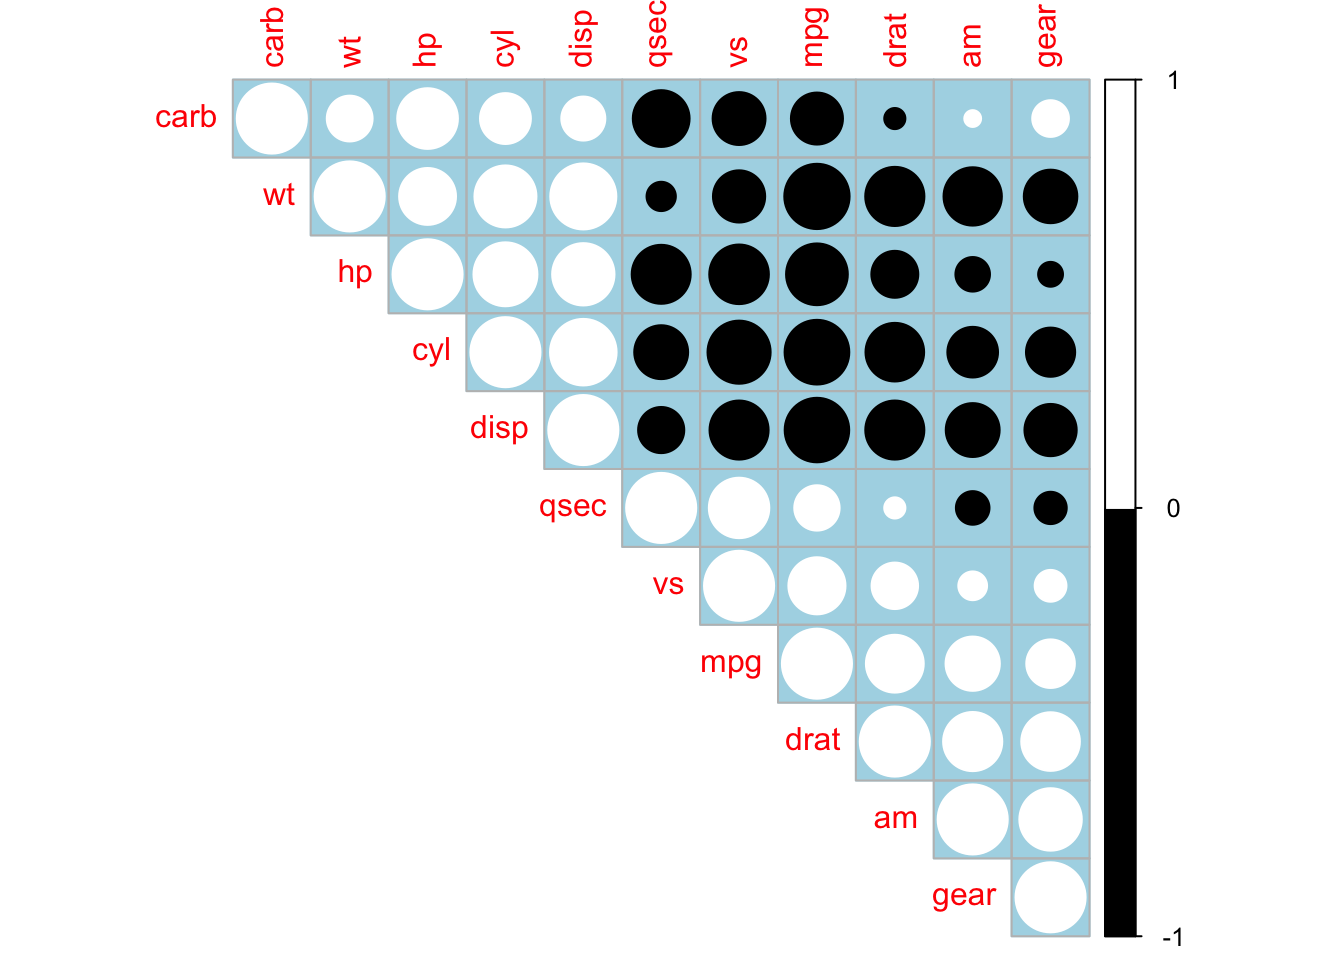
使用不同的色谱
# 如上一节所示,可以定制相关图的颜色。该功能colorRampPalette()非常便于产生色谱。

col1 <- colorRampPalette(c("#7F0000", "red", "#FF7F00", "yellow", "white",
                           "cyan", "#007FFF", "blue", "#00007F"))
col2 <- colorRampPalette(c("#67001F", "#B2182B", "#D6604D", "#F4A582",
                           "#FDDBC7", "#FFFFFF", "#D1E5F0", "#92C5DE",
                           "#4393C3", "#2166AC", "#053061"))
col3 <- colorRampPalette(c("red", "white", "blue"))
col4 <- colorRampPalette(c("#7F0000", "red", "#FF7F00", "yellow", "#7FFF7F",
                           "cyan", "#007FFF", "blue", "#00007F"))
whiteblack <- c("white", "black")

## using these color spectra
par(mfrow=c(2,2))
corrplot(M, order = "hclust", addrect = 2, col = col1(100))
corrplot(M, order = "hclust", addrect = 2, col = col2(50))
corrplot(M, order = "hclust", addrect = 2, col = col3(20))
corrplot(M, order = "hclust", addrect = 2, col = col4(10))
par(mfrow=c(1,1))
corrplot(M, order = "hclust", addrect = 2, col = whiteblack, bg = "gold2")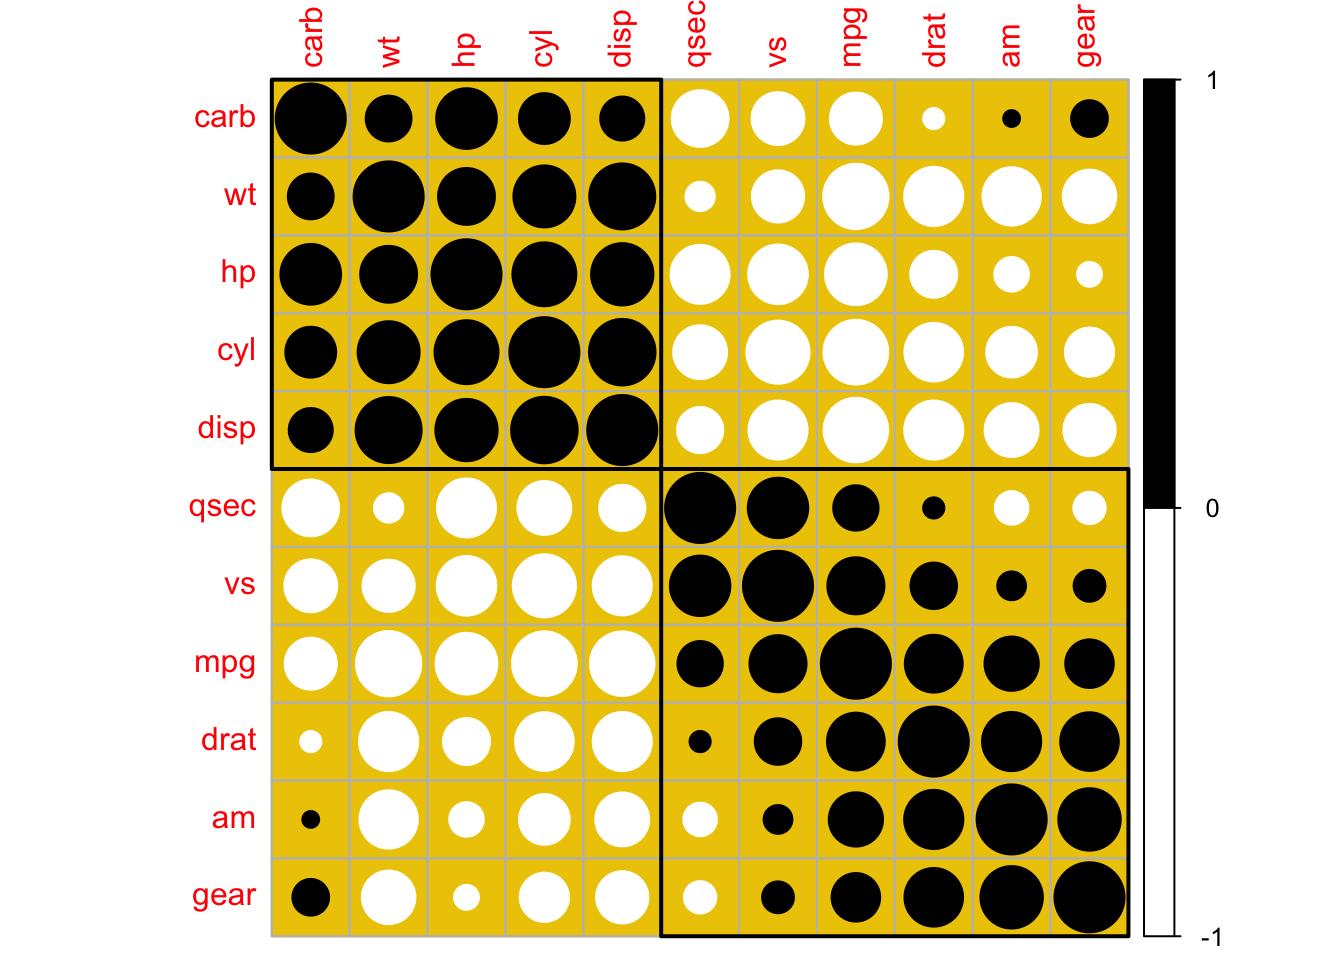
### 使用调色板包
# 您也可以使用标准调色板(包grDevices)
par(mfrow=c(2,2))
corrplot(M, order = "hclust", addrect = 2, col = heat.colors(100))
corrplot(M, order = "hclust", addrect = 2, col = terrain.colors(100))
corrplot(M, order = "hclust", addrect = 2, col = cm.colors(100))
corrplot(M, order = "hclust", addrect = 2, col = gray.colors(100))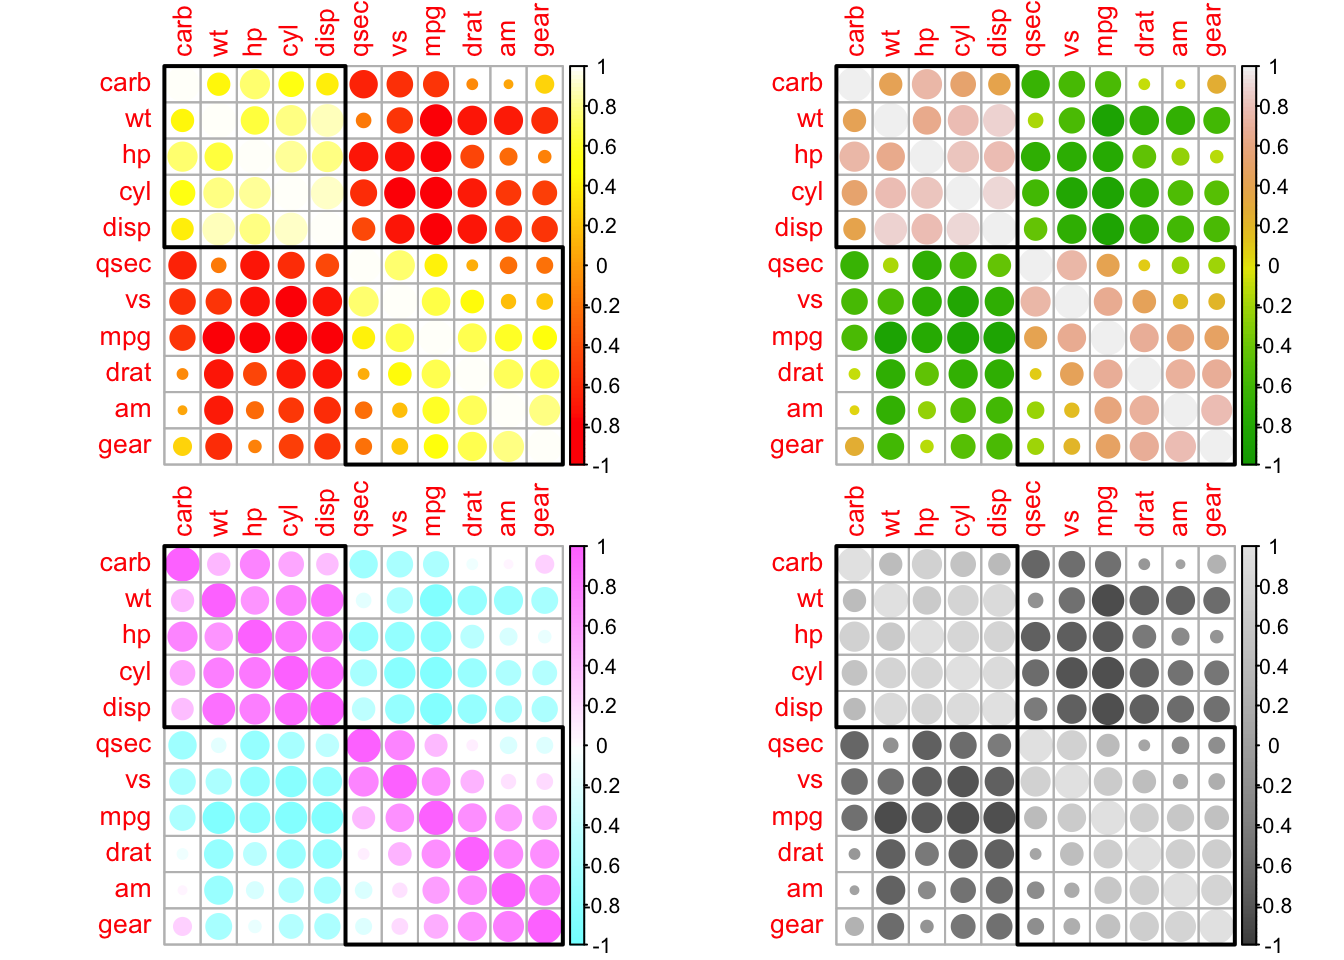
### 使用调色板包---使用RcolorBrewer包。

library(RColorBrewer)
corrplot(M, type = "upper", order = "hclust",col = brewer.pal(n = 8, name = "RdBu"))
corrplot(M, type = "upper", order = "hclust",col = brewer.pal(n = 8, name = "RdYlBu"))
corrplot(M, type = "upper", order = "hclust",col = brewer.pal(n = 8, name = "PuOr"))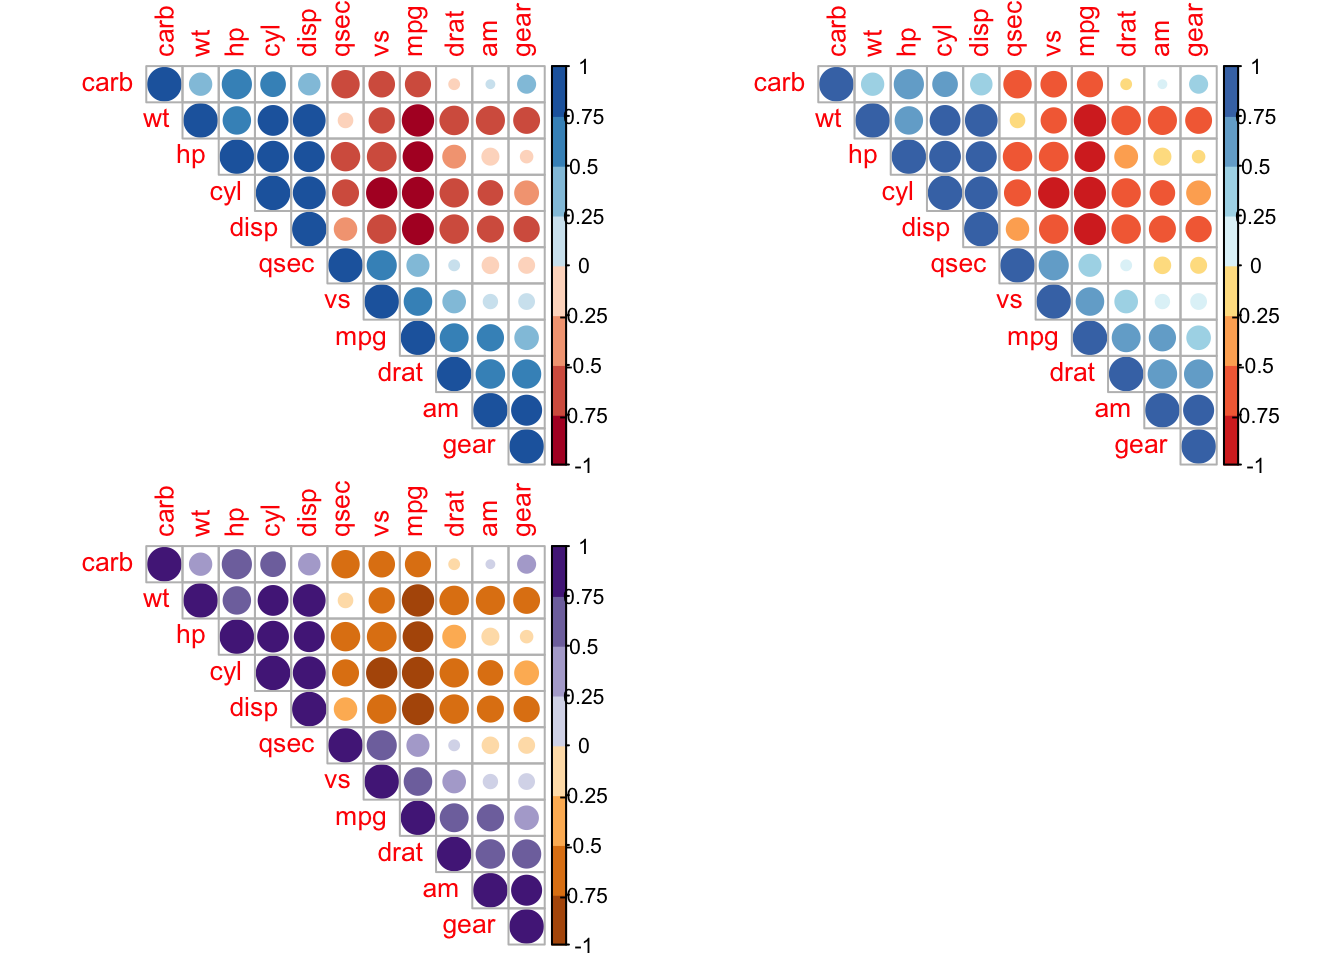
更改文本标签和图例的颜色和旋转
参数 cl.* 用于设置图例的颜色,tl.* 用于设置图例的文本。
对于文本标签,这两个函数tl.col(文本标签颜色)和tl.srt(文本标签字符串旋转)用于更改文本颜色和旋转。
par(mfrow=c(2,2))

## remove color legend and text legend 移除图例的颜色部分和文字标签部分
corrplot(M, order = "AOE", cl.pos = "n", tl.pos = "n")

## bottom  color legend, diagonal text legend, rotate text label
## 图底图例,对角线文字图例,旋转文字标签
corrplot(M, order = "AOE", cl.pos = "b", tl.pos = "d", tl.srt = 60)

## a wider color legend with numbers right aligned
corrplot(M, order = "AOE", cl.ratio = 0.2, cl.align = "r")

## text labels rotated 45 degrees
corrplot(M, type = "lower", order = "hclust", tl.col = "black", tl.srt = 45)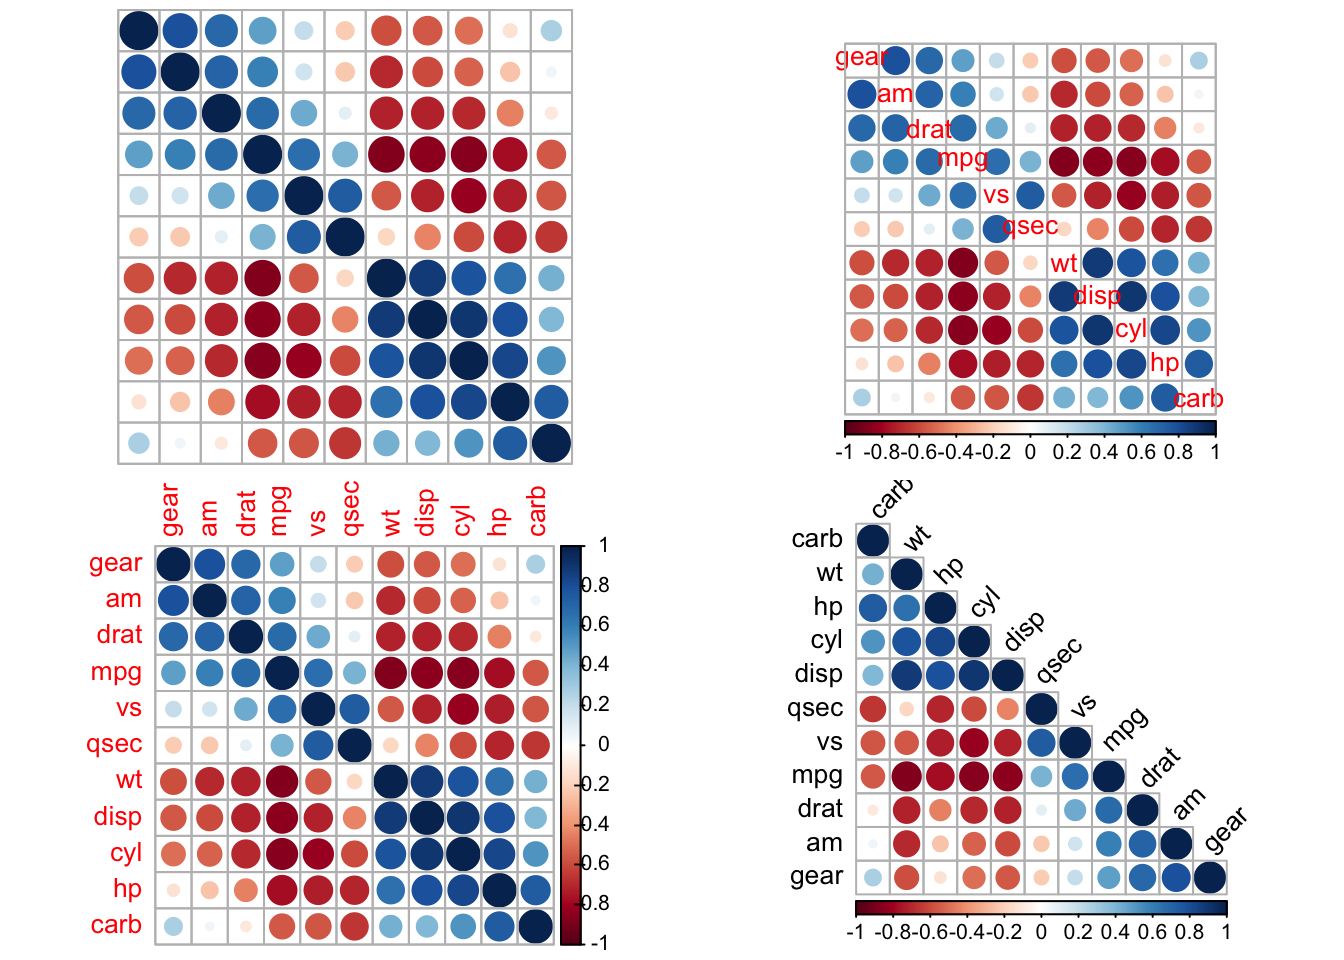
处理非相关矩阵
par(mfrow=c(2,2))
corrplot(abs(M),order = "AOE", col = col3(200), cl.lim = c(0, 1))

## visualize a  matrix in [-100, 100]
ran <- round(matrix(runif(225, -100,100), 15))
corrplot(ran, is.corr = FALSE, method = "square")

## a beautiful color legend
corrplot(ran, is.corr = FALSE, method = "ellipse", cl.lim = c(-100, 100))

#如果矩阵是矩形,则可以使用win.asp参数调整纵横比, 以使矩阵呈现为正方形。
ran <- matrix(rnorm(70), ncol = 7)
corrplot(ran, is.corr = FALSE, win.asp = .7, method = "circle")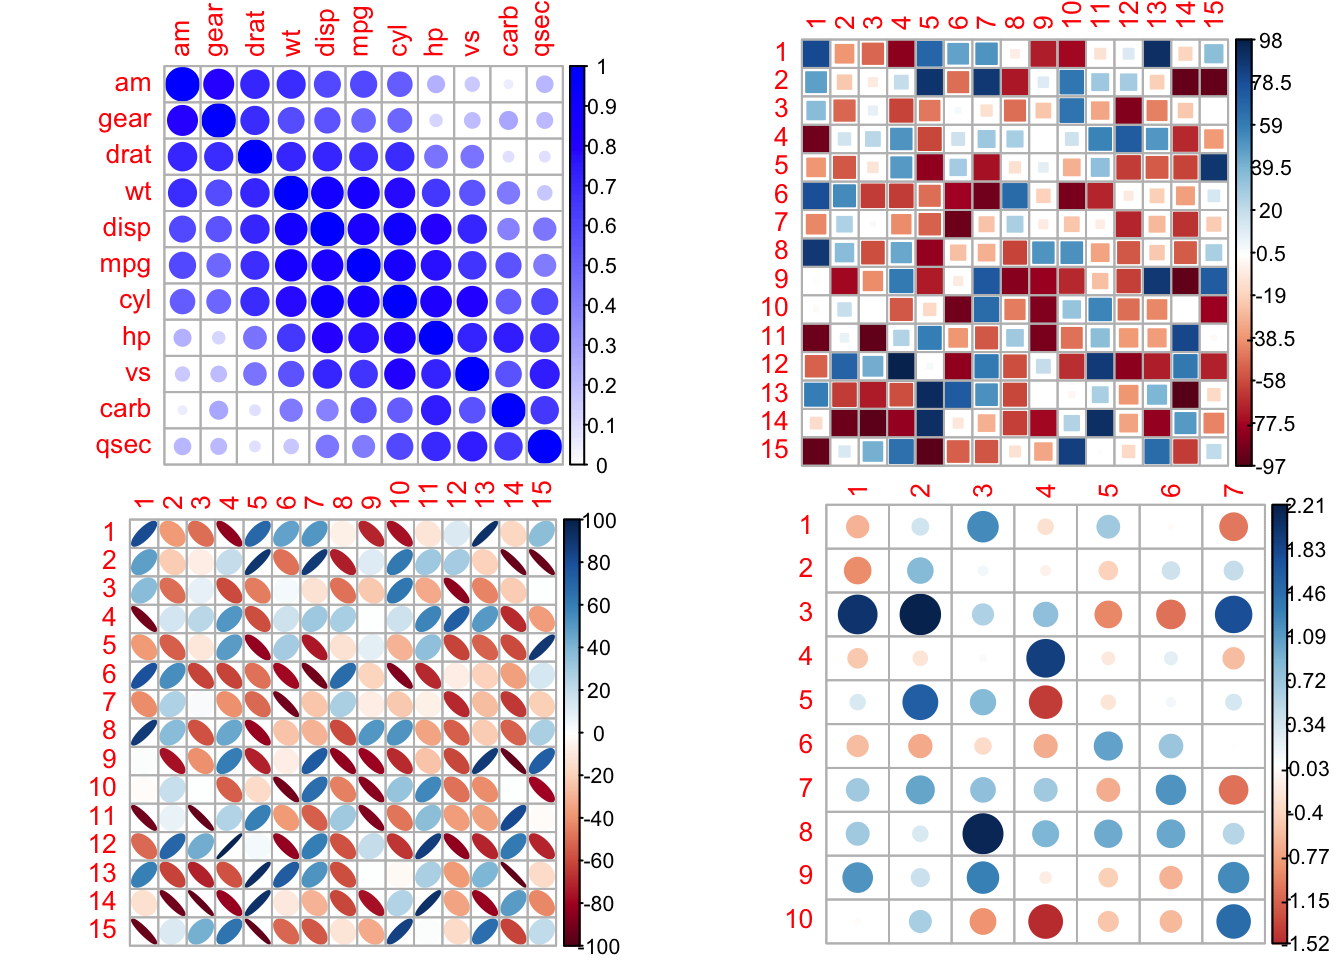
处理缺失(NA)值
默认情况下,corrplot将NA值呈现为“?”字符。使用na.label 参数,可以使用不同的值(最多支持两个字符)。
M2 <- M
diag(M2) = NA
corrplot(M2)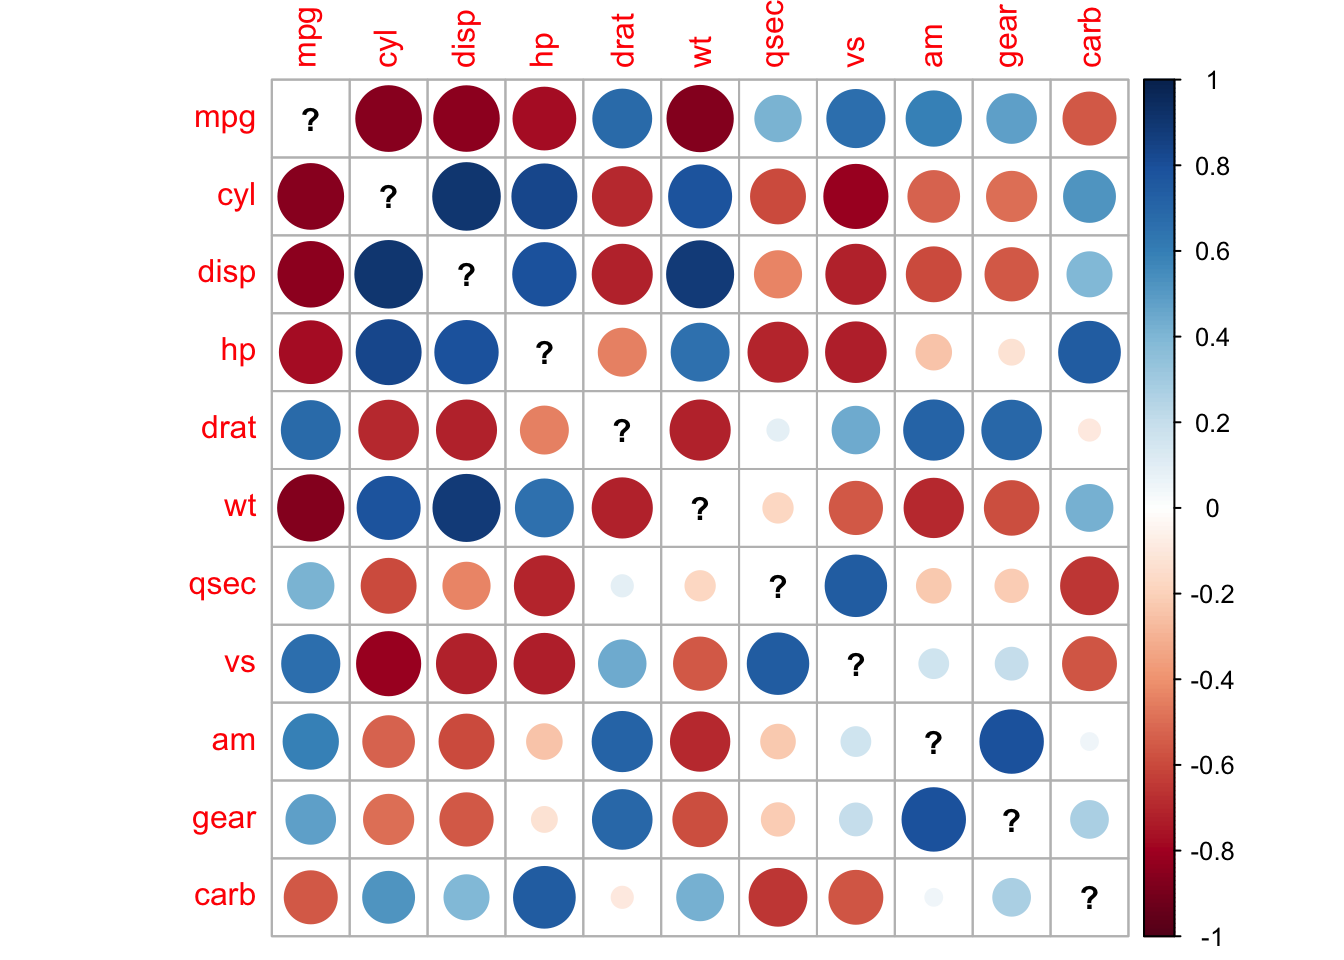
par(mfrow=c(1,2))
corrplot(M2, na.label = "o")
corrplot(M2, na.label = "NA")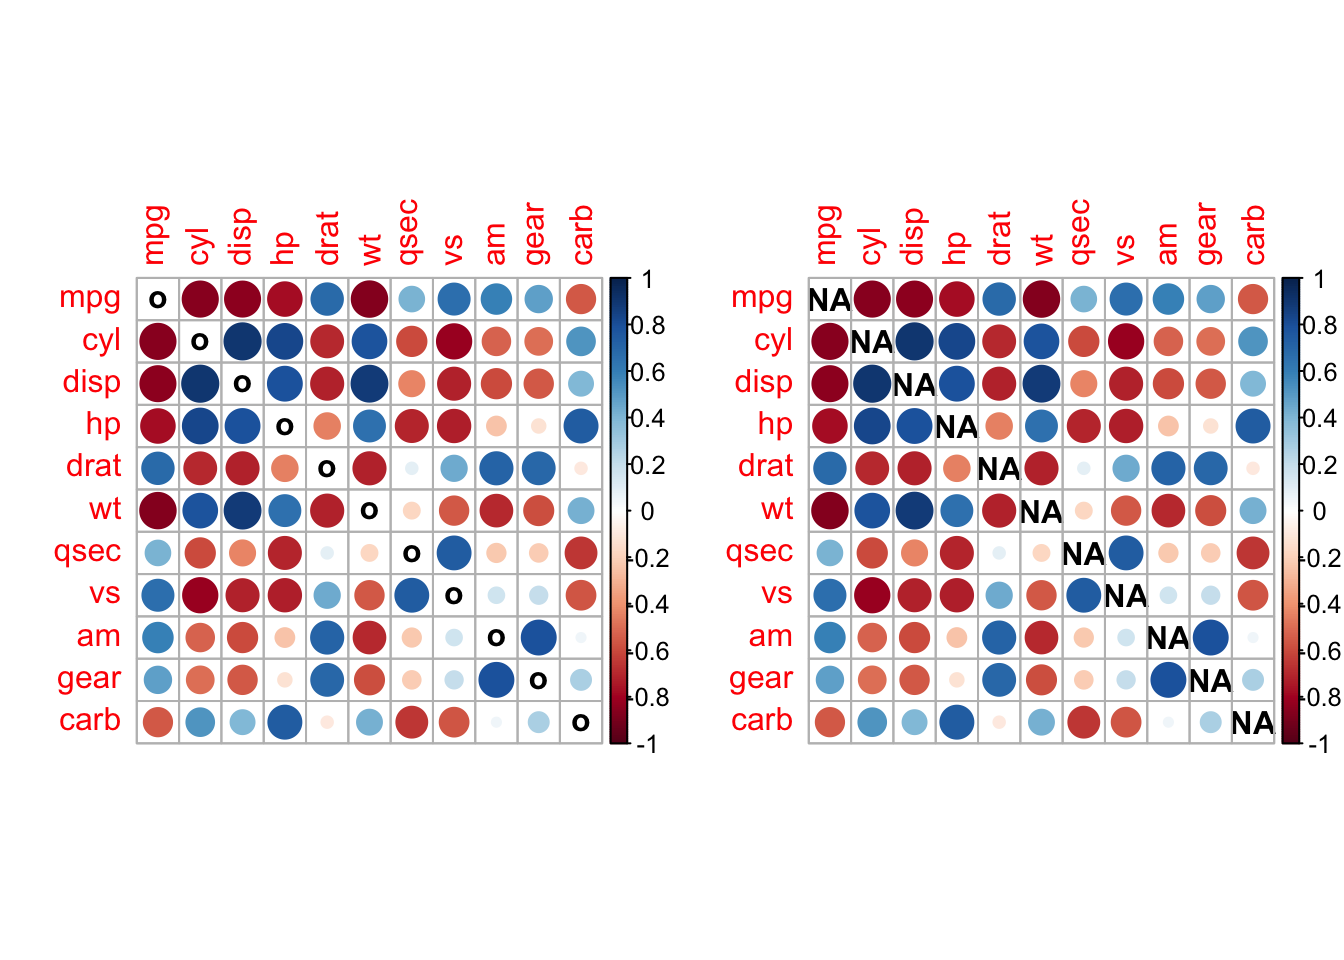
在标签中使用"plotmath"表达式
从版本开始0.78,可以 在变量名中使用plotmath表达式。要激活plotmath渲染,请在标签前加上一个字符":","="or "$"。
M2 <- M[1:5,1:5]
colnames(M2) <- c("alpha", "beta", ":alpha+beta", ":a[0]", "=a[beta]")
rownames(M2) <- c("alpha", "beta", NA, "$a[0]", "$ a[beta]")
corrplot(M2)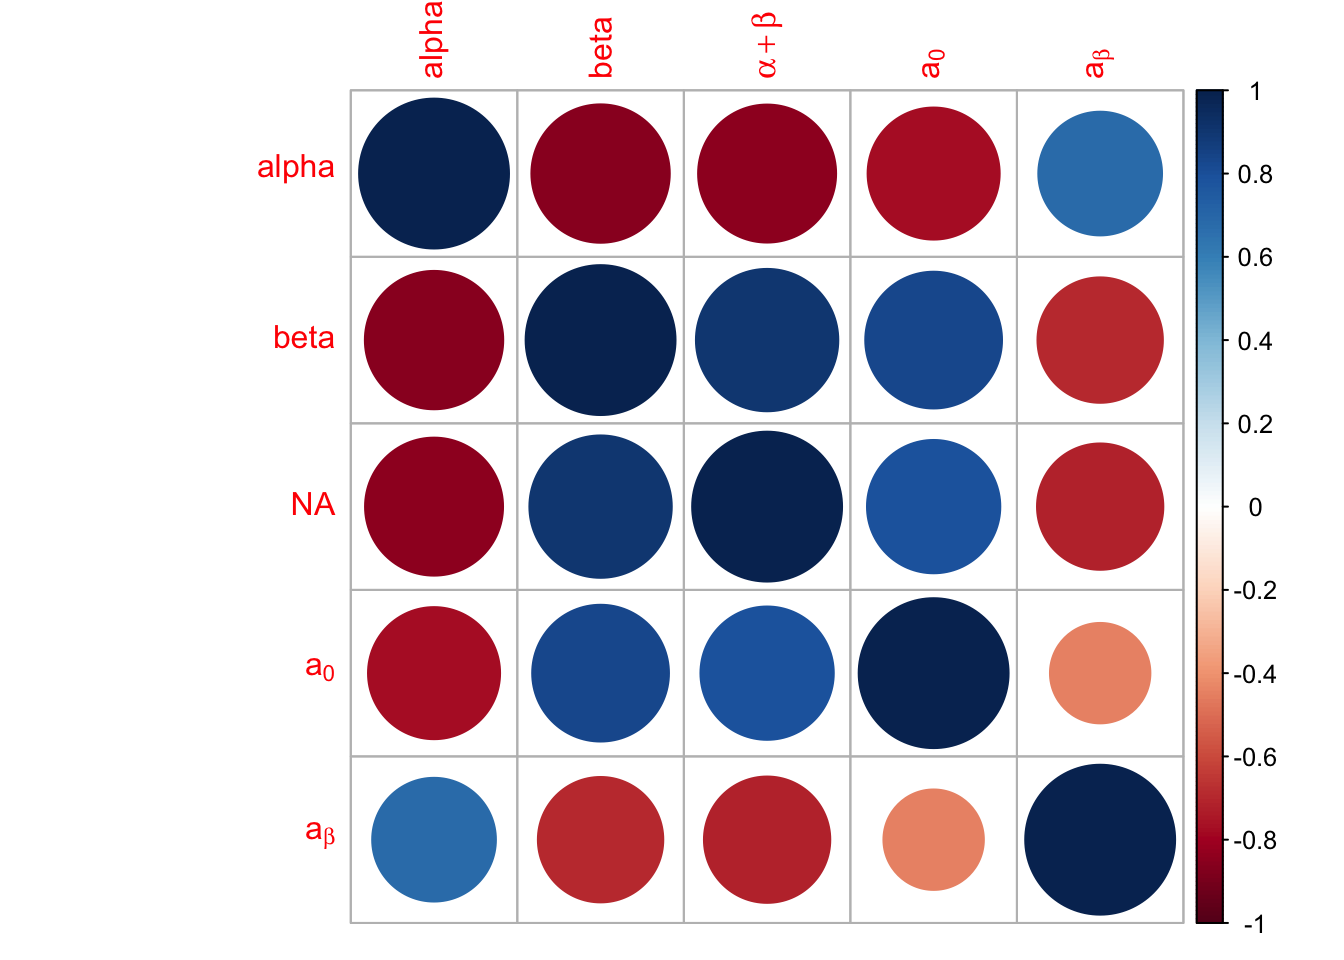
将相关图与显着性检验相结合
res1 <- cor.mtest(mtcars, conf.level = .95)
res2 <- cor.mtest(mtcars, conf.level = .99)
par(mfrow=c(1,3))
## specialized the insignificant value according to the significant level
corrplot(M, p.mat = res1$p, sig.level = .2)

corrplot(M, p.mat = res1$p, sig.level = .05)

corrplot(M, p.mat = res1$p, sig.level = .01)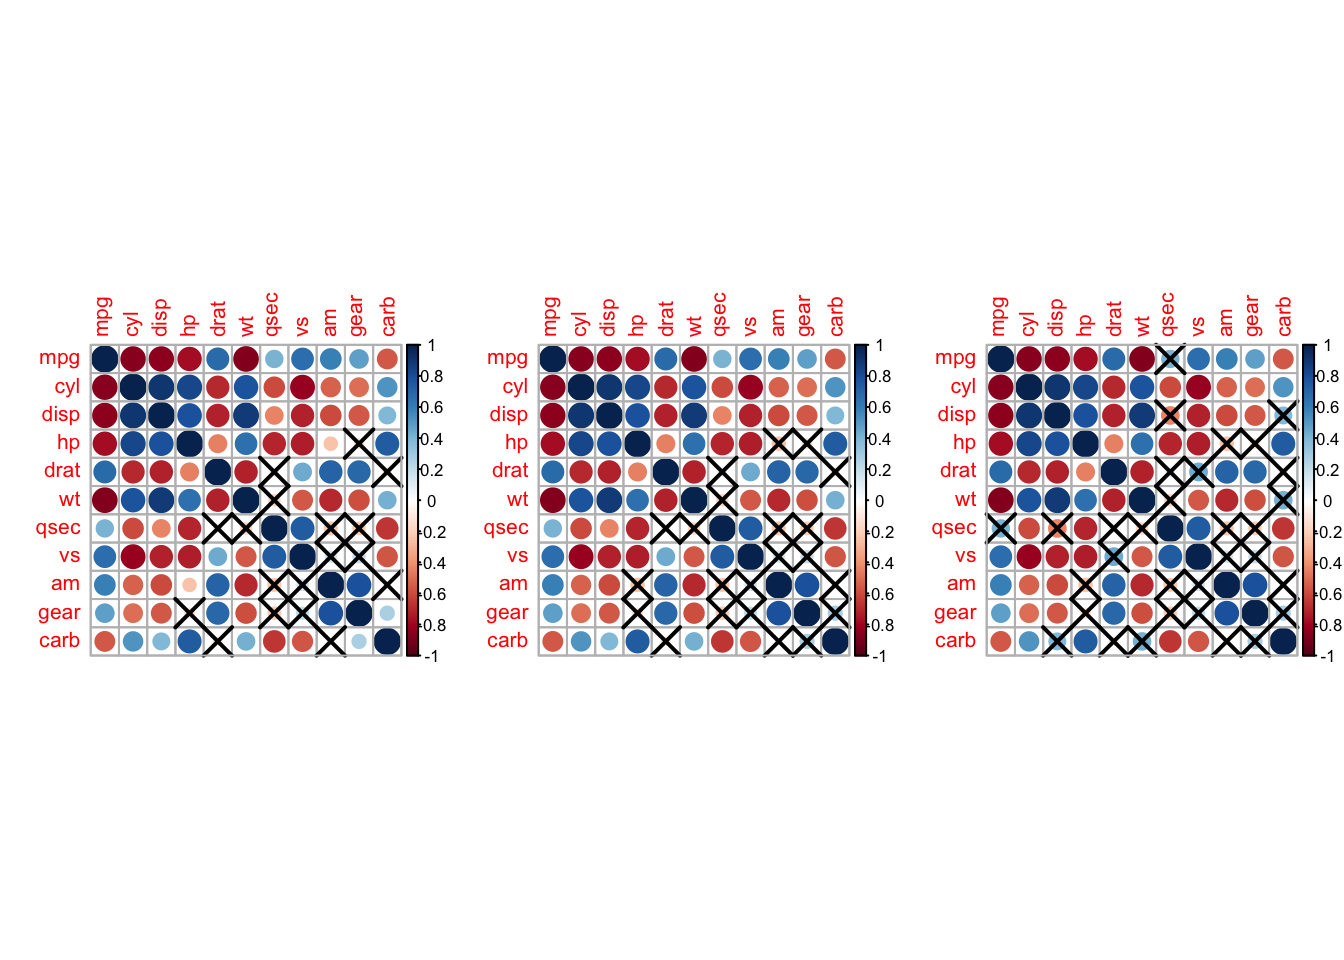
## leave blank on no significant coefficient
corrplot(M, p.mat = res1$p, insig = "blank")

## add p-values on no significant coefficient
corrplot(M, p.mat = res1$p, insig = "p-value")

## add all p-values
corrplot(M, p.mat = res1$p, insig = "p-value", sig.level = -1)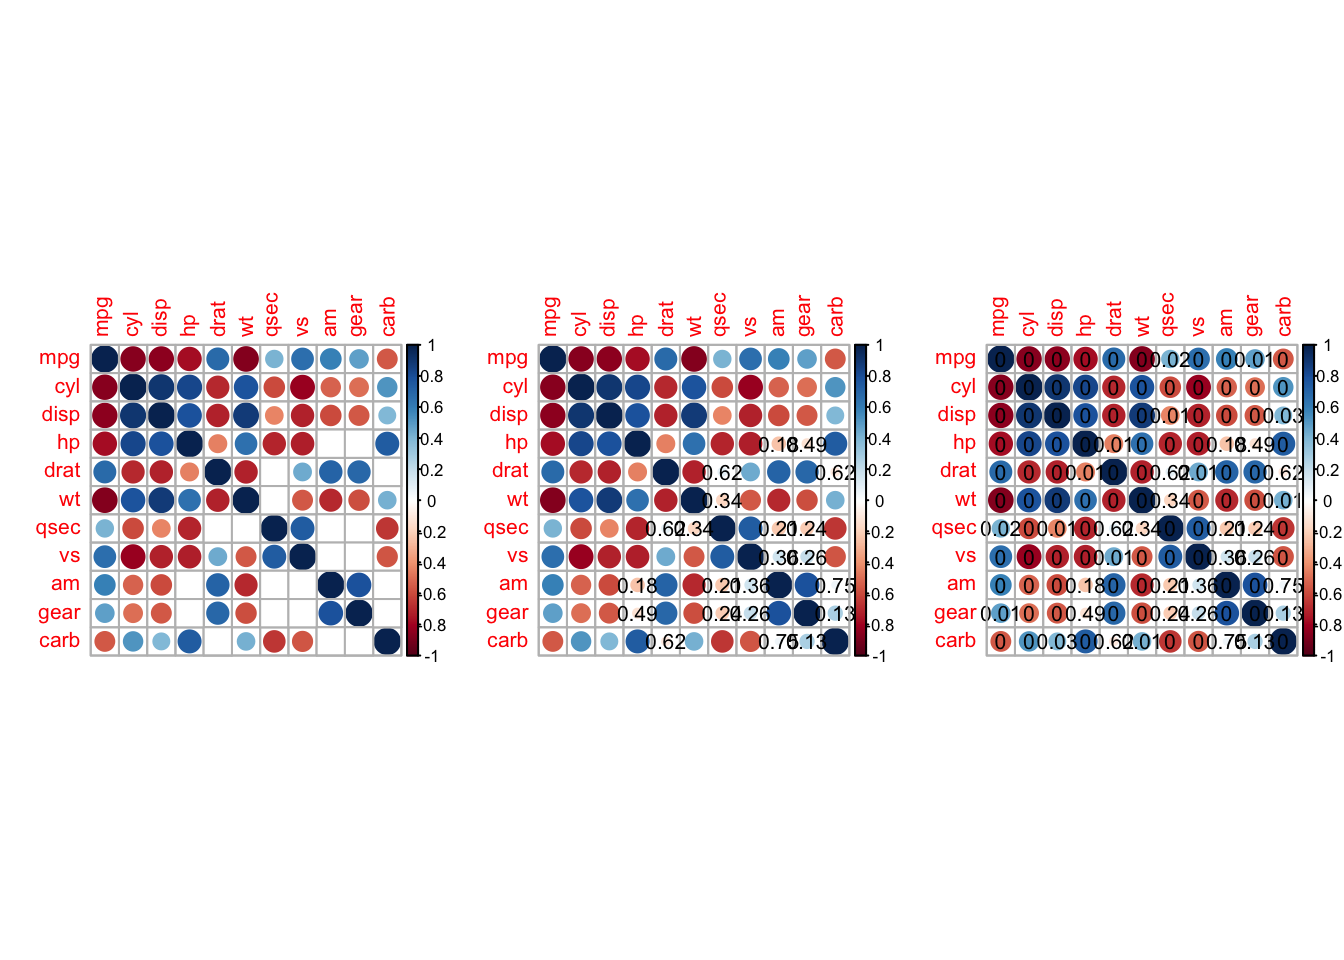
## add cross on no significant coefficient
par(mfrow=c(1,1))
corrplot(M, p.mat = res1$p, order = "hclust", insig = "pch", addrect = 3)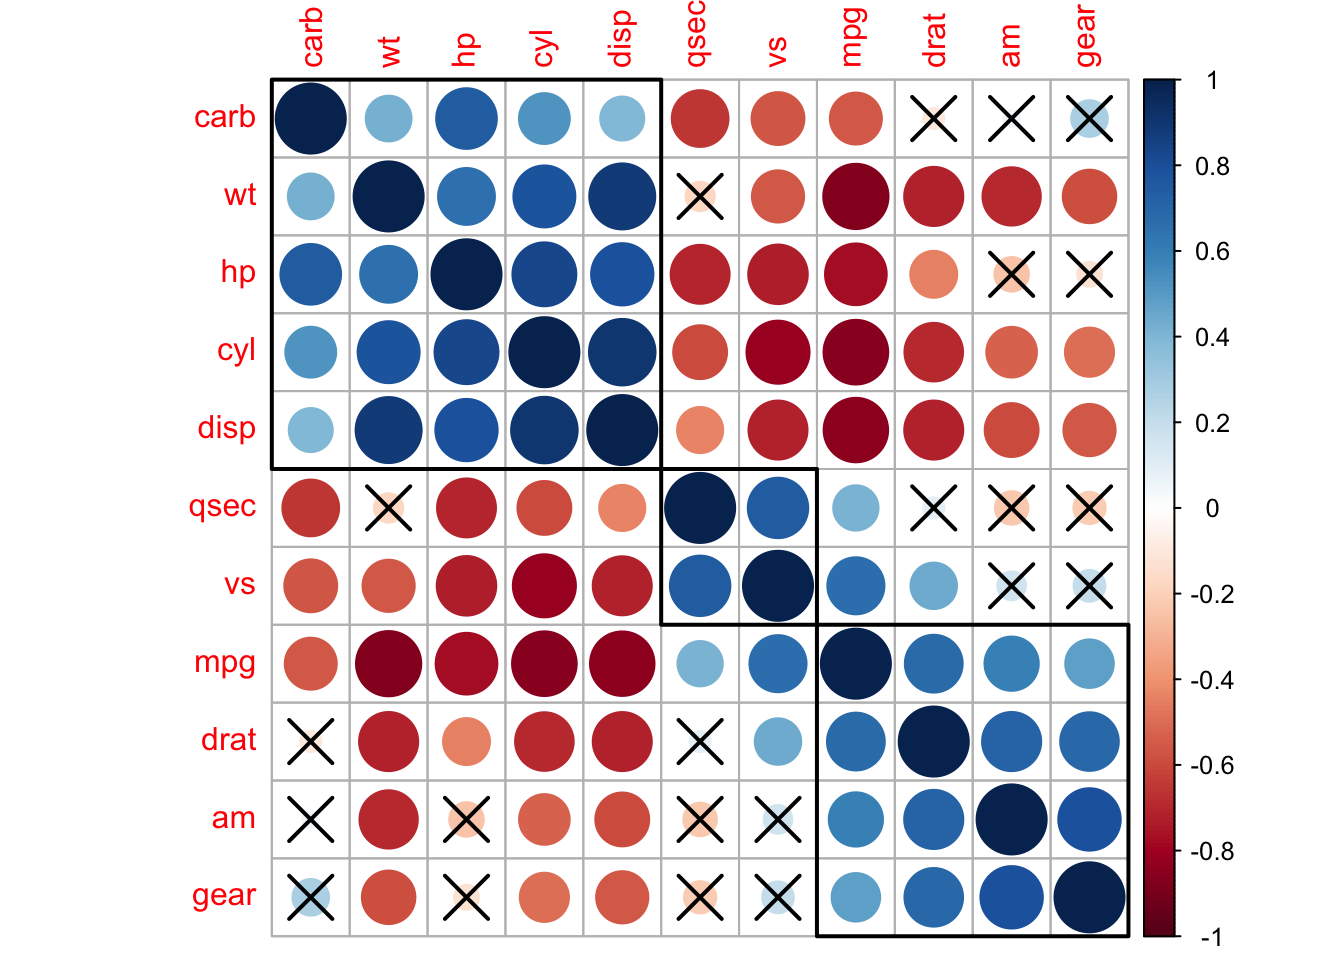
可视化置信区间
par(mfrow=c(3,2))
corrplot(M, low = res1$lowCI, upp = res1$uppCI, order = "hclust",
         rect.col = "navy", plotC = "rect", cl.pos = "n")


corrplot(M, p.mat = res1$p, low = res1$lowCI, upp = res1$uppCI,
         order = "hclust", pch.col = "red", sig.level = 0.01,
         addrect = 3, rect.col = "navy", plotC = "rect", cl.pos = "n")


res1 <- cor.mtest(mtcars, conf.level = .95)
corrplot(M, p.mat = res1$p, insig = "label_sig",
         sig.level = c(.001, .01, .05), pch.cex = .9, pch.col = "white")


corrplot(M, p.mat = res1$p, method = "color",
         insig = "label_sig", pch.col = "white")


corrplot(M, p.mat = res1$p, method = "color", type = "upper",
         sig.level = c(.001, .01, .05), pch.cex = .9,
         insig = "label_sig", pch.col = "white", order = "AOE")


corrplot(M, p.mat = res1$p, insig = "label_sig", pch.col = "white",
         pch = "p<.05", pch.cex = .5, order = "AOE")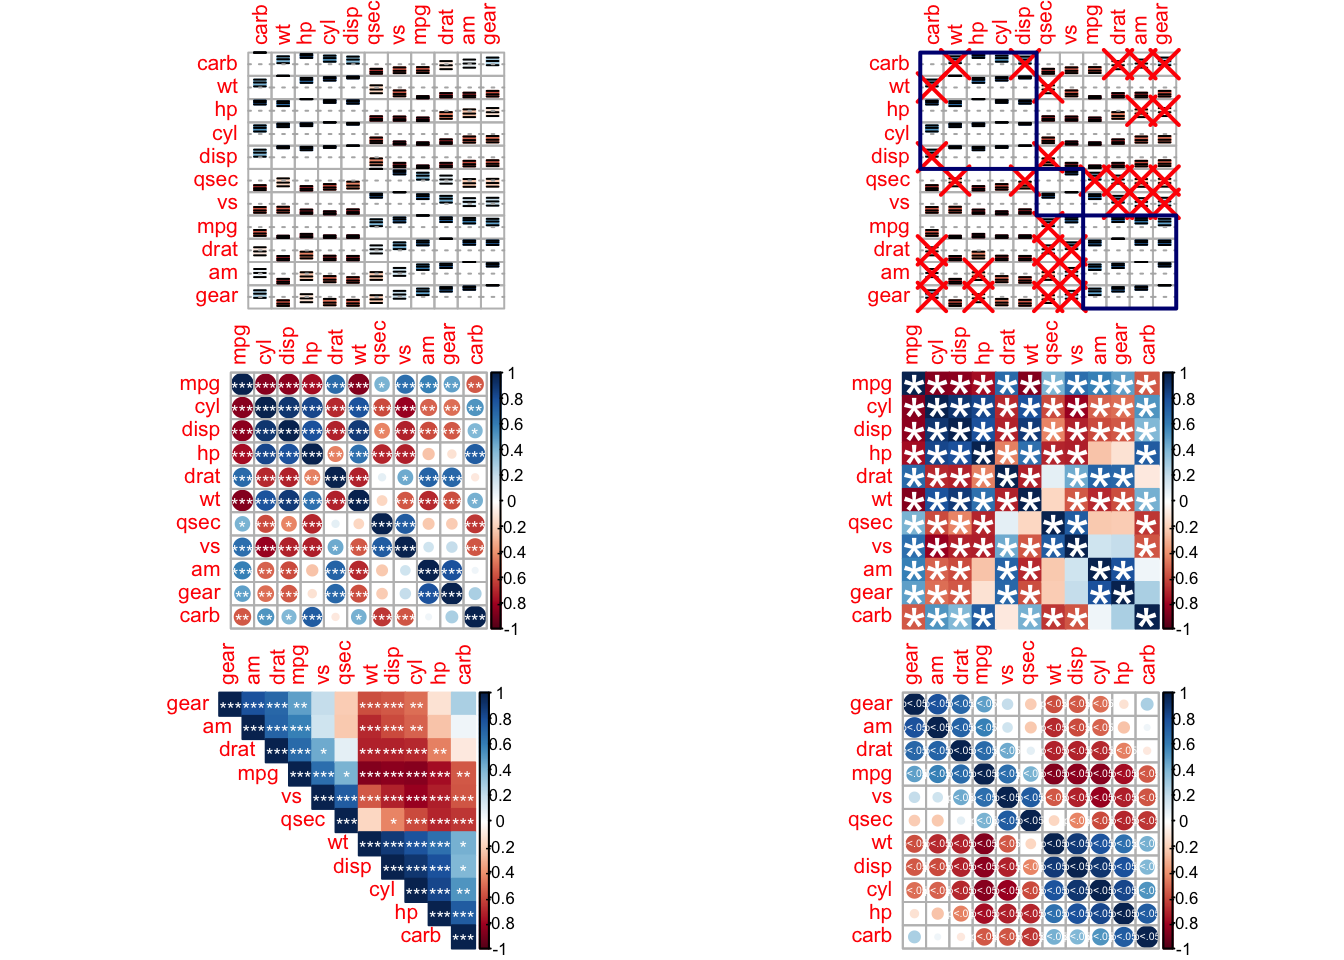
自定义相关图
略
参考: https://cran.r-project.org/web/packages/corrplot/vignettes/corrplot-intro.html
sessionInfo()
#> R version 4.0.2 (2020-06-22)
#> Platform: x86_64-apple-darwin17.0 (64-bit)
#> Running under: macOS Mojave 10.14.5
#>
#> Matrix products: default
#> BLAS:   /Library/Frameworks/R.framework/Versions/4.0/Resources/lib/libRblas.dylib
#> LAPACK: /Library/Frameworks/R.framework/Versions/4.0/Resources/lib/libRlapack.dylib
#>
#> locale:
#> [1] zh_CN.UTF-8/zh_CN.UTF-8/zh_CN.UTF-8/C/zh_CN.UTF-8/zh_CN.UTF-8
#>
#> attached base packages:
#> [1] stats     graphics  grDevices utils     datasets  methods   base
#>
#> other attached packages:
#> [1] RColorBrewer_1.1-2 corrplot_0.84
#>
#> loaded via a namespace (and not attached):
#>  [1] compiler_4.0.2  magrittr_1.5    bookdown_0.20   tools_4.0.2
#>  [5] htmltools_0.5.0 yaml_2.2.1      stringi_1.4.6   rmarkdown_2.3
#>  [9] blogdown_0.20   knitr_1.29      stringr_1.4.0   digest_0.6.25
#> [13] xfun_0.17       rlang_0.4.7     evaluate_0.14